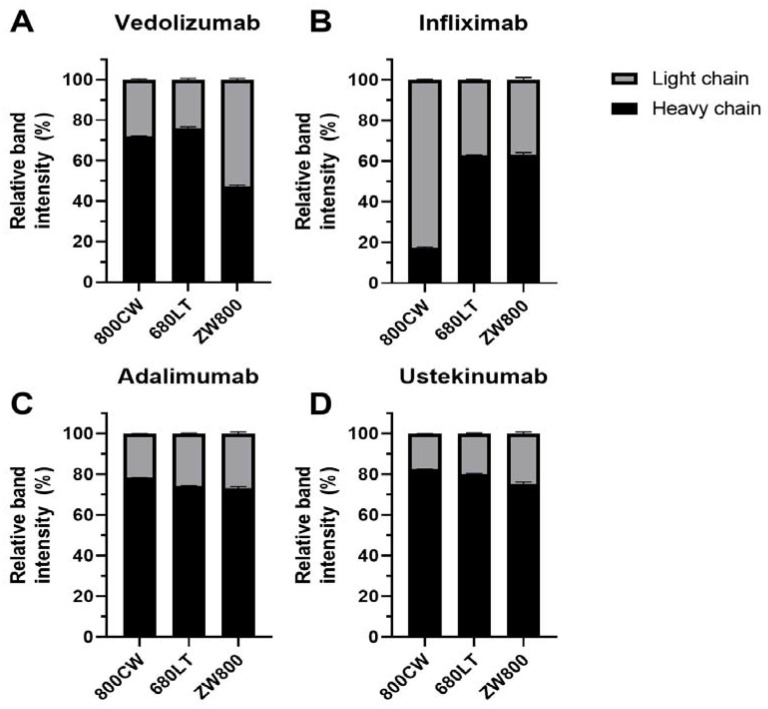
Figure 4.
Relative distribution of dye signals across heavy and light chains measured on sodium dodecyl sulfate polyacrylamide gel electrophoresis (SDS-PAGE). ZW800 conjugates did not have visible heavy and light chain signal, data displayed from regions of interest placed at the estimated band position based on coomassie. Adalimumab (C) and ustekinumab (D) show similar distribution patterns, where dye is mostly on the heavy chain (range adalimumab: 73.1–78.2%, ustekinumab 75.3–82.5%). Infliximab-800CW (B) shows a very low amount of heavy chain binding (17.4%). Light chain binding is also seen to a lesser extent in other infliximab conjugates (680LT: 62.8% HC; ZW800: 63.1% HC). Vedolizumab (A) shows mostly heavy chain binding, but shows more per-dye fluctuation than other antibodies (800CW: 72.0% HC; 680LT: 75.9% HC; ZW800-1: 47.3% HC). Increased light chain binding could be related to tracer instability.

