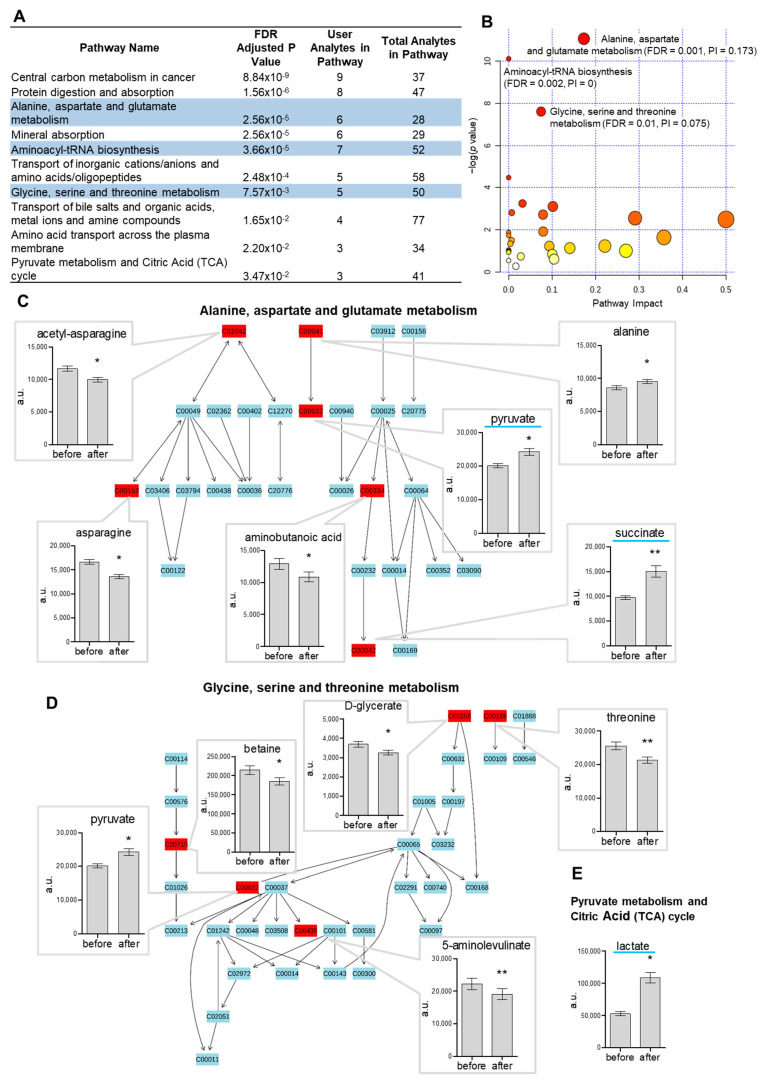
Figure 3.
The pathway analysis of metabolome using (A) RaMP showing overlapping results (blue-highlighted pathways) with the analysis from (B) Metaboanalyst, where the 3 significantly represented pathways (FDR < 0.05) are identified, and (C–E) the top pathways are shown in detail, with the significantly regulated metabolites in plasma before/after ice-water swimming shown in bar plots (mean ± SD), * p < 0.05/** p < 0.01 analyzed by Wilcoxon matched pairs signed-rank test with Benjamini-Hochberg correction. (C) Alanine, aspartate and glutamate metabolism pathway, (D) glycine, serine and threonine metabolism pathway and (E) pyruvate metabolism and citric acid (TCA) cycle, where the remaining regulated metabolites pyruvate and succinate are shown in (C), highlighted in blue. PI—pathway impact score.

