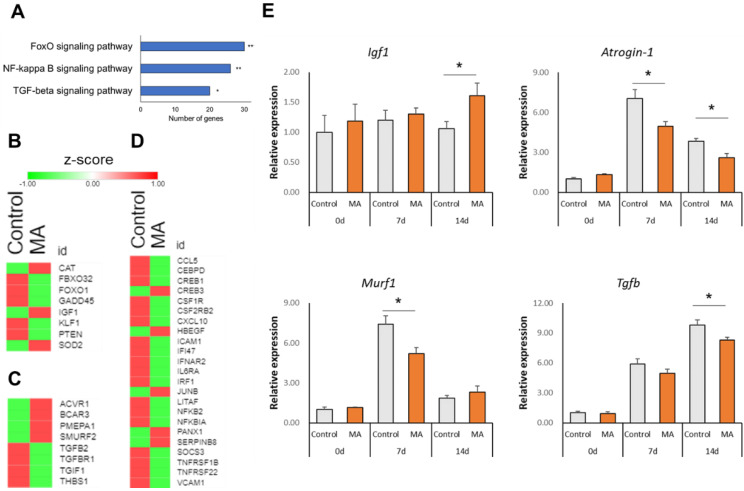
Figure 3.
Changes in muscle protein degradation-related factors. (A) Bar graph showing significantly enriched selected KEGG pathways. Heat maps showing row z-score of DEGs involved in (B) FoxO signaling, (C) TGF-β signaling, and inflammatory response (D). (E) Relative mRNA expression levels of Igf1, Atrogin-1, Murf1, and Tgfb by qPCR analysis. Data are shown as mean ± SEM (n = 3–6), * p < 0.05, ** p < 0.01 vs. control.

