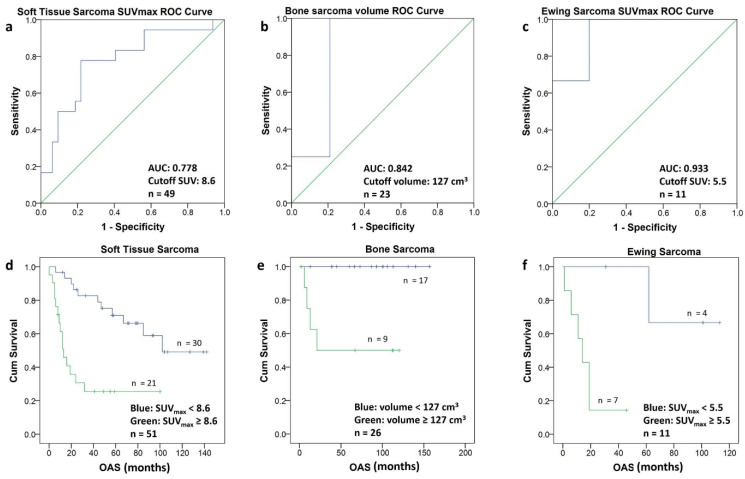
Figure 5.
(a–f) The ROC-Curves for soft tissue sarcomas (a), bone sarcomas (b) and Ewing sarcomas (c) allowed to calculate a cutoff value (Youden Index) for SUVmax and for the volume, respectively. Using the calculated cutoff value each population was divided into two groups. The Kaplan–Meier curves of the two groups in soft tissue sarcomas (d) bone sarcomas (e) and Ewing sarcomas (f) are depicted. The Kaplan–Meier curves include patients with short follow-up (n = 5).

