Figure 2.
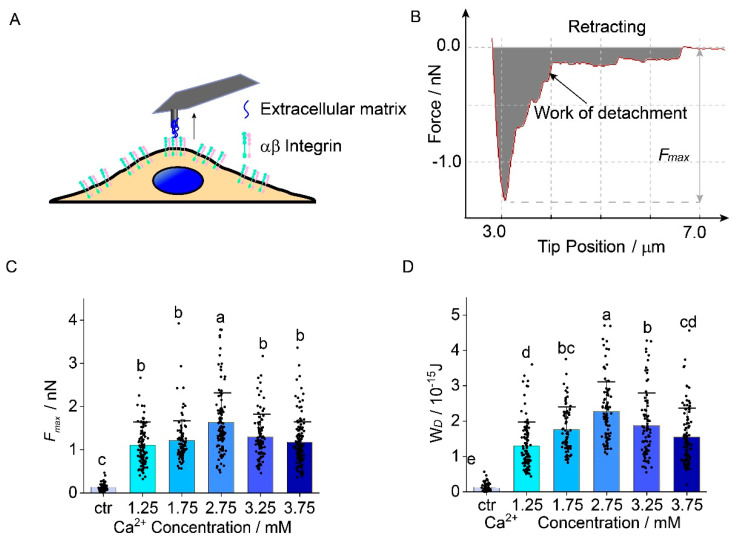
The effects of extracellular Ca2+ concentration on adhesion between human chondrocytes and extracellular matrix. (A) Schematic of the measurement for the adhesion between chondrocytes and extracellular matrix on AFM tip; (B) Example of a retraction force-distance curve obtained by cell to extracellular matrix adhesion measurement. Fmax is the difference between the peak force value and the baseline of complete detachment. Work of detachment (The gray region) represents the energy during the detachment process; (C) As Ca2+ concentration increases, forces between chondrocytes and extracellular matrix increase by 48.0% and reach the peak at 2.75 mM Ca2+ concentration then decrease by 26% Ca2+ concentration from 2.75 mM to 3.75 mM; (D) The energy during the detachment process increases by 72% from Ca2+ concentration 1.75 mM to 2.75 mM, decreases by 31.3% from Ca2+ concentration 2.75 mM to 3.75 mM. 90 cells for each group are measured and analyzed. ANOVA and Tukey’s post hoc is performed for data analysis. Letters (a, b, c, and d) above the bars correspond to distributions that are (letters different) or are not significantly different (letter shared) at the p < 0.05 level.

