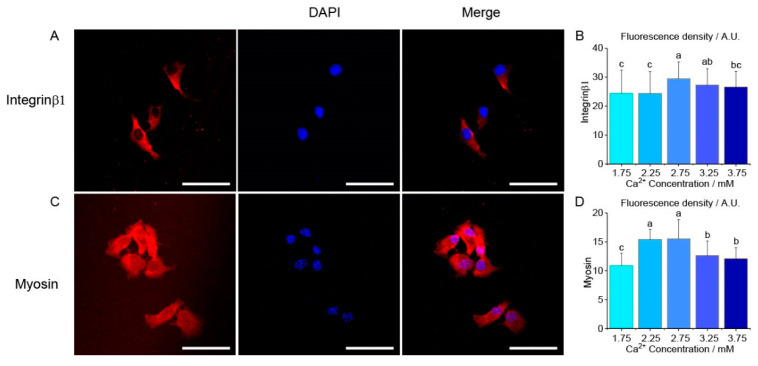
Figure 6.
The effects of extracellular Ca2+ concentration on human chondrocytes myosin and integrinβ1 fluorescence density. (A) A representative integrinβ1 fluorescence image taken at 1.75 mM Ca2+ concentration. Scale bar 50 μm; (B) As Ca2+ concentration increases, fluorescence density of integrinβ1 increased by 20% from 1.75 mM to 2.75 mM, and then decreased from the 2.75 mM group to 3.75 mM. (C) A representative myosin fluorescence image taken at 1.75 mM Ca2+ concentration. Scale bar 50 μm; (D) As Ca2+ concentration increases, fluorescence density of myosin increased by 50% from 1.75 mM to 2.75 mM and then decreased by 20% from 2.75 mM to 3.75 mM. 60 cells are measured and analyzed in each group. Letters (a, b, c) above the bars in (B,D) correspond to distributions that are (letters different) or are not significantly different (letter shared) at the p < 0.01 level.

