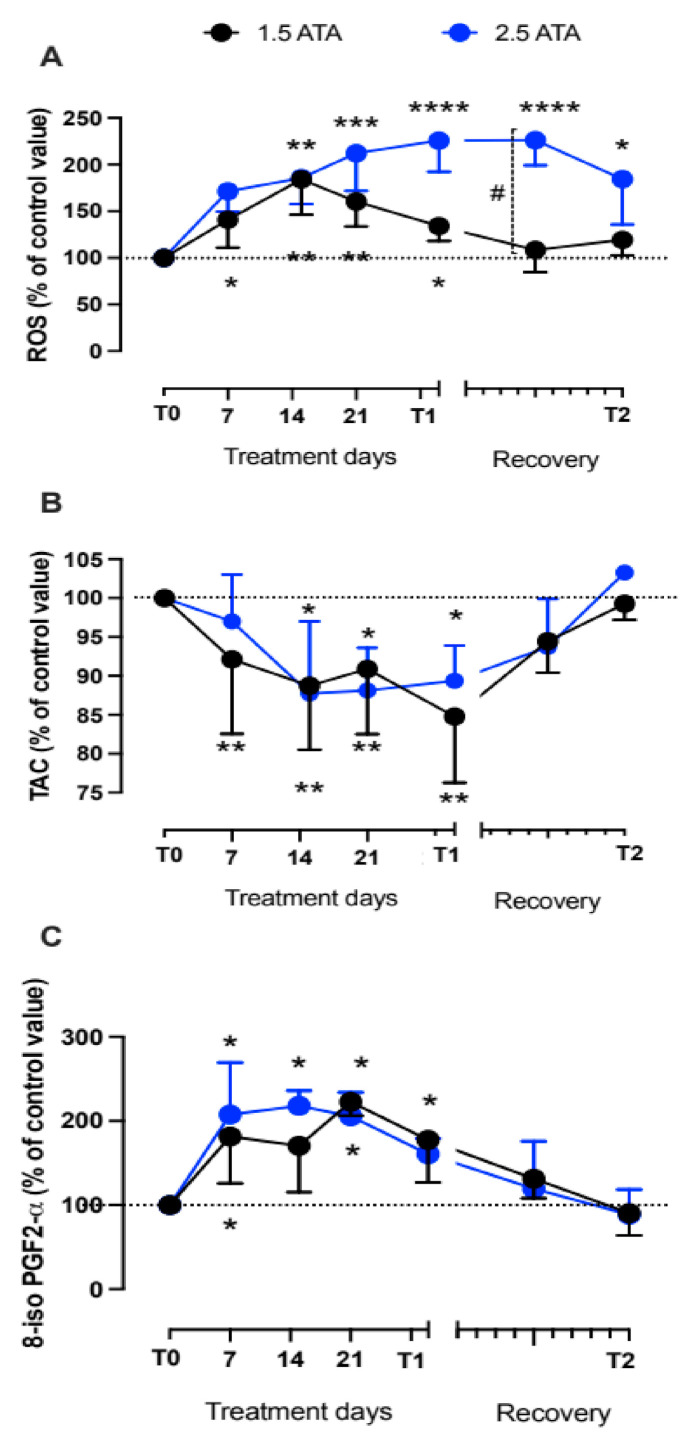
Figure 2.
Collected samples during treatments session at 1.5 and 2.5 ATA, and recovery. Time course (% ± SD) of (A) Reactive Oxygen Species (ROS) production and (B) Total Antioxidant Capacity (TAC) detected on saliva by EPR technique, and (C) 8-isoprostane (8-iso PGF2α) measured on urine by immune-enzymatic assay. Significant difference intra-group: * p < 0.05; ** p < 0.01; *** p < 0.001, **** p < 0.0001. Significant difference between groups: # p < 0.05.

