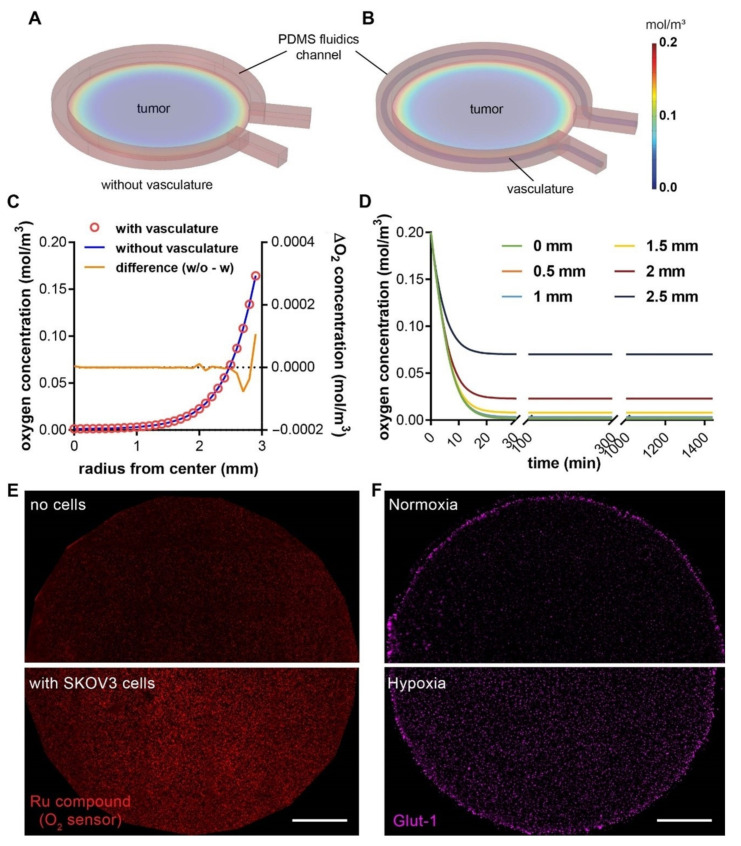
Figure 4.
COMSOL simulation of oxygen profiles in hypoxic tumor models without or with the vascular channel. Oxygen profile in (A) a tumor model with microfluidic channel alone, and (B) a composite vascularized hypoxic tumor model. (C) Radial distribution of oxygen concentrations from the center to the edge of the tumor region without (blue line; the left y-axis) or with vasculature (red circles; the left y-axis), and the difference between the two (orange line; the right y-axis). (D) Rapid achievement of the steady-state oxygen levels at different radial positions in the vascularized tumor model. Model dimensions are the same as the actual sizes. (E) Measurement of oxygen levels in the tumor section without (top) or with (bottom) SKOV3 cancer cells at 24 h, using an oxygen-sensitive ruthenium compound absorbed in silica microparticles and embedded in a thin layer of PDMS on the PC pillar. Higher fluorescence indicates lower oxygen level. (F) The expression of Glut-1, a hypoxic marker, in the embedded SKOV3 cancer cells in the tumor section in normoxia (top, hypoxia model removed of the PC cap on day 0) vs. hypoxia (bottom) model after 24 h of culture. Scale bars: 1 mm.

