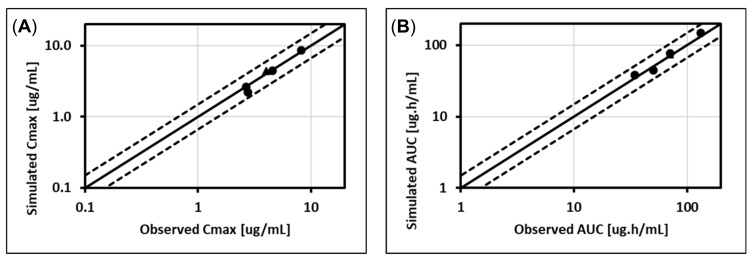
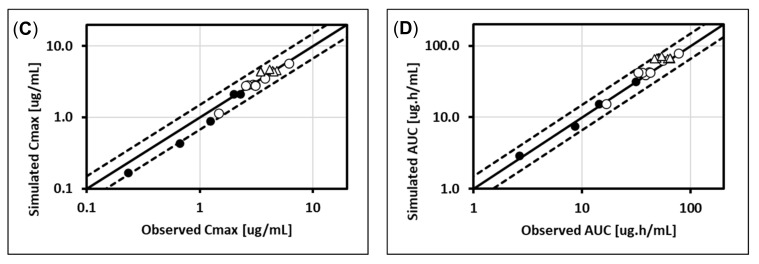
Figure 3.
Comparison of observed Cmax and AUC (AUC0–t or AUCtau) from different published studies [67,68,70,71,72,73,74,75,76,77,78] with final model simulations for studies used for model development (A,B) and model validation (C,D). Circles represent fasted studies, triangles represent studies where dolutegravir was administered with a moderate-fat meal, closed symbols represent single dose data, and open symbols represent steady-state data. In each plot, the solid line represents the identity line, and the dashed lines show margins for 1.5-fold errors. AUC = the area under the plasma concentration–time curve, AUC0–t = AUC from time zero to t, AUCtau = AUC during the dosing interval, and Cmax = maximum observed total plasma concentration.


