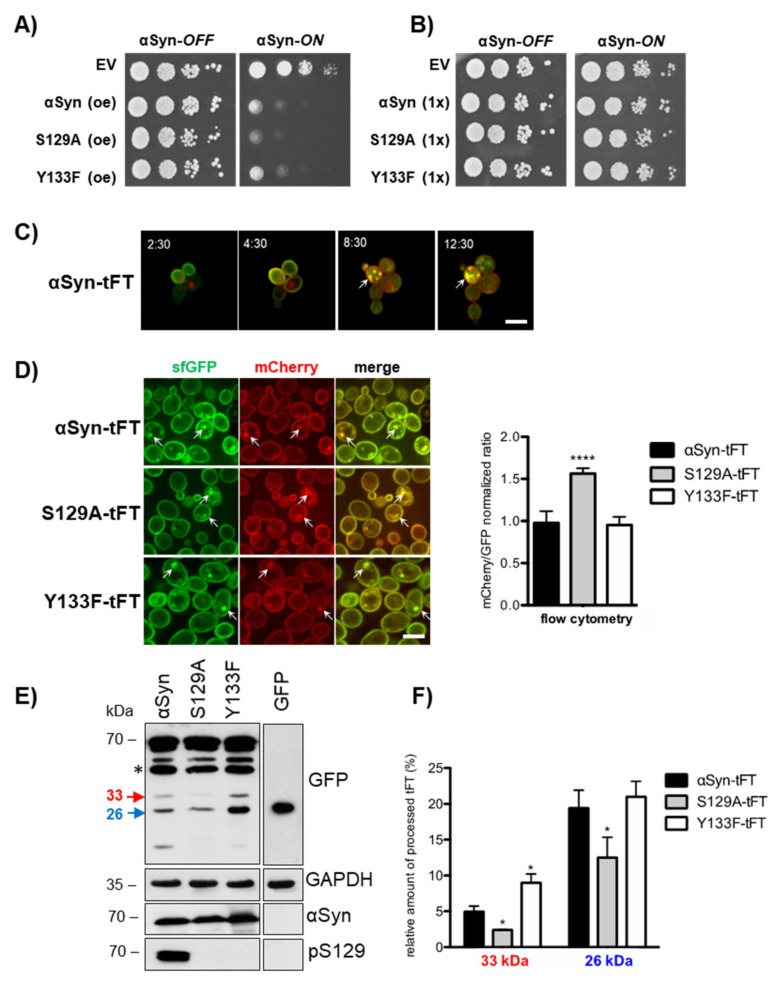
Figure 1.
Phosphorylation at S129 promotes αSyn turnover. (A) Spotting test of yeast cells without (αSyn-OFF) or with (αSyn-ON) induction of GAL1-driven αSyn-GFP, S129A-GFP or Y133-GFP expression from 2 µ plasmids (oe—overexpression). Empty vector (EV) was used as a control. (B) Spotting test of corresponding yeast cells, expressing only a single integrated gene copy (1×) of GAL1-driven αSyn-tandem fluorescent timer (tFT), S129A-tFT, Y133-tFT or EV. (C) Fluorescence microscopy time series of yeast cells expressing single copy αSyn-tFT. The merge images show cells three-dimensionally trapped in a microfluidic device at the indicated time points after GAL1 promoter-mediated induction. Intracellular inclusions are marked with arrows. Scale bar = 5 µm. (D) Fluorescence microscopy of strains expressing single-copy, tFT-tagged αSyn variants after 6 h induction of the GAL1 promoter (left panel). Intracellular inclusions are marked with arrows. Scale bar = 5 µm. Fluorescence measurements with flow cytometry of the indicated strains (right panel). In total, 10,000 events were counted for each experiment. The significance of the differences was calculated with a t-test relative to αSyn-tFT (****, p < 0.0001, n = 6). (E) Western blot analysis of protein extracts from cells expressing single-copy, tFT-tagged αSyn variants or GFP as the control using GFP-antibody. The membrane was stripped and re-probed consecutively with αSyn antibody, S129 phosphorylation-specific αSyn antibody (pS129) or GAPDH antibody as the loading control. Only αSyn but no variant is phosphorylated at S129. The 33 kDa (red) fragment indicates proteasomal and the 26 kDa (blue) autophagy/vacuole-mediated degradation products. Asterisks indicate an mCherry∆N product resulting from mCherry hydrolysis during cell extract preparation [57]. (F) Densitometric analysis of the immunodetection of the specific tFT-αSyn degradation products. The relative intensity of the characteristic low molecular immunoblot bands was determined to examine the fate of the αSyn fusions. Band intensity relations within the same lane were quantified with ImageJ from anti-GFP immunoblot images. The relative amount of tFT degradation fragments to the total amount of loaded protein within one lane was calculated. The significance of the differences was determined with a t-test relative to αSyn (*, p < 0.05, n = 3).

