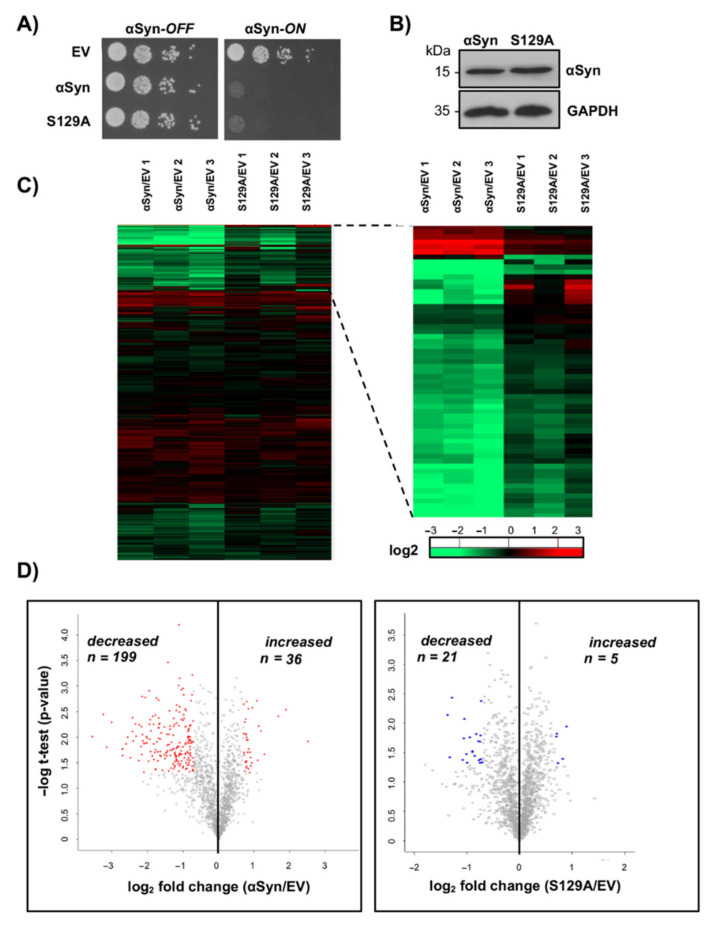
Figure 2.
Expression of αSyn changes significantly the relative protein abundance, whereas S129A has less impact on the yeast proteome. (A) Growth assay of yeast cells expressing GAL1-driven αSyn or S129A from a 2 µ plasmid with an empty vector (EV) as a control. Cells were spotted in 10-fold dilutions on selective plates containing glucose (αSyn-OFF) or galactose (αSyn-ON). (B) Western blot analysis with protein crude extracts of cells expressing αSyn or S129A after overnight induction in SILAC strain RH3493. GAPDH was used as a loading control. (C) Heatmap of the protein enrichment relative to the empty vector control (EV) (n = 3; isotope label-swap replication). Colors indicate the levels of enrichment: green—downregulation; red—upregulation; black—non-significantly regulated. The right panel represents magnification of the indicated section. (D) Volcano plot analysis. Proteins were ranked according to their statistical p-value (y-axis) and their relative abundance ratio (log2-fold change) (x-axis). The threshold for significance was p 0.05 and log2-fold change −0.7 or 0.7. Proteins with significantly changed abundance upon αSyn or S129A expression are colored in red or blue, respectively.

