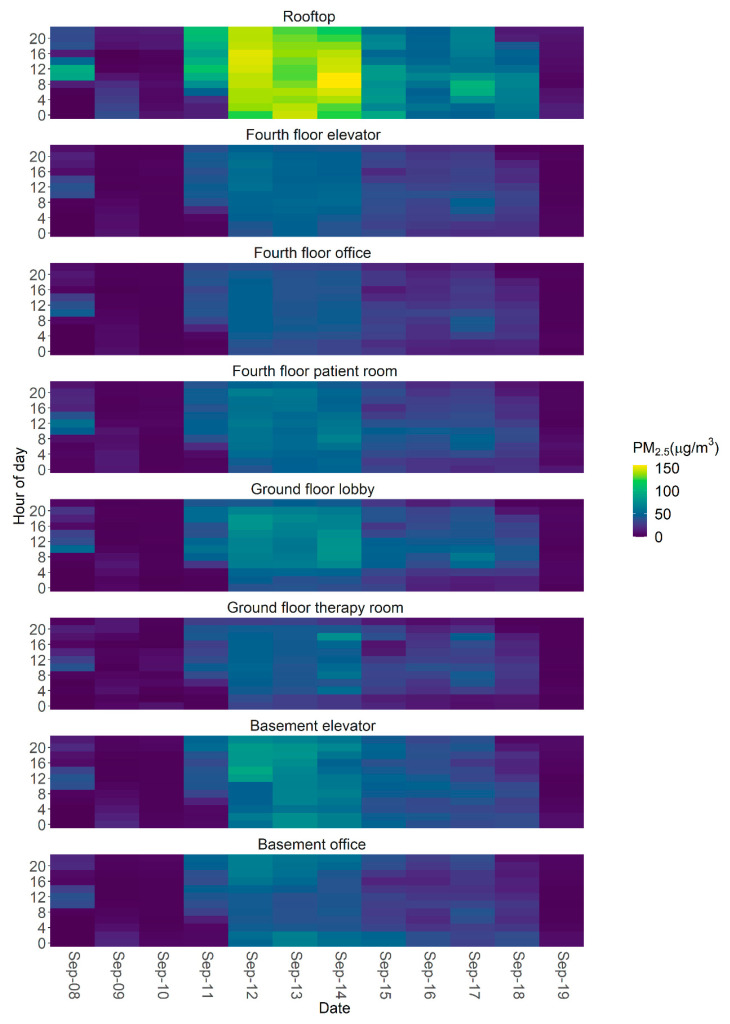
Figure 5.
Heat maps of 2-h averaged PM2.5 concentrations at the rehabilitation facility during the wildfire smoke episode. The low cost sensor on the rooftop is shown at the top, and those located indoors are shown below. The y-axis of each plot indicates the time of day. Indoor peaks have not been removed from these data. Data from the morning of September 11 show that smoke moved rapidly indoors as the rooftop concentration started to increase, and overnight data from September 18–19 show that smoke cleared rapidly out of the building as rooftop concentration decreased.

