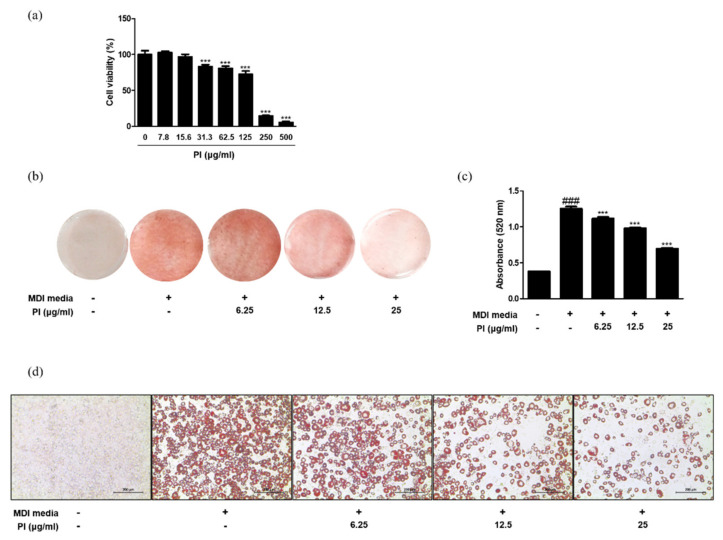
Figure 6.
Effects of papain on adipocyte differentiation in MDI–treated 3T3–L1 preadipocytes. (a) Cell viability of papain in 3T3–L1 preadipocytes. *** p < 0.001 vs. non-treated group. (b) Oil red O staining 8 days after induction. (c) Quantitative analysis of Oil Red O staining. Oil Red O stained cells were extracted with isopropyl alcohol and the absorbance at 520 nm was measured. (d) Macroscopic shots of oil red O staining are shown. The values are given as the mean ± SD ### p < 0.001 vs. non-treated group; *** p < 0.001 vs. MDI-treated group.

