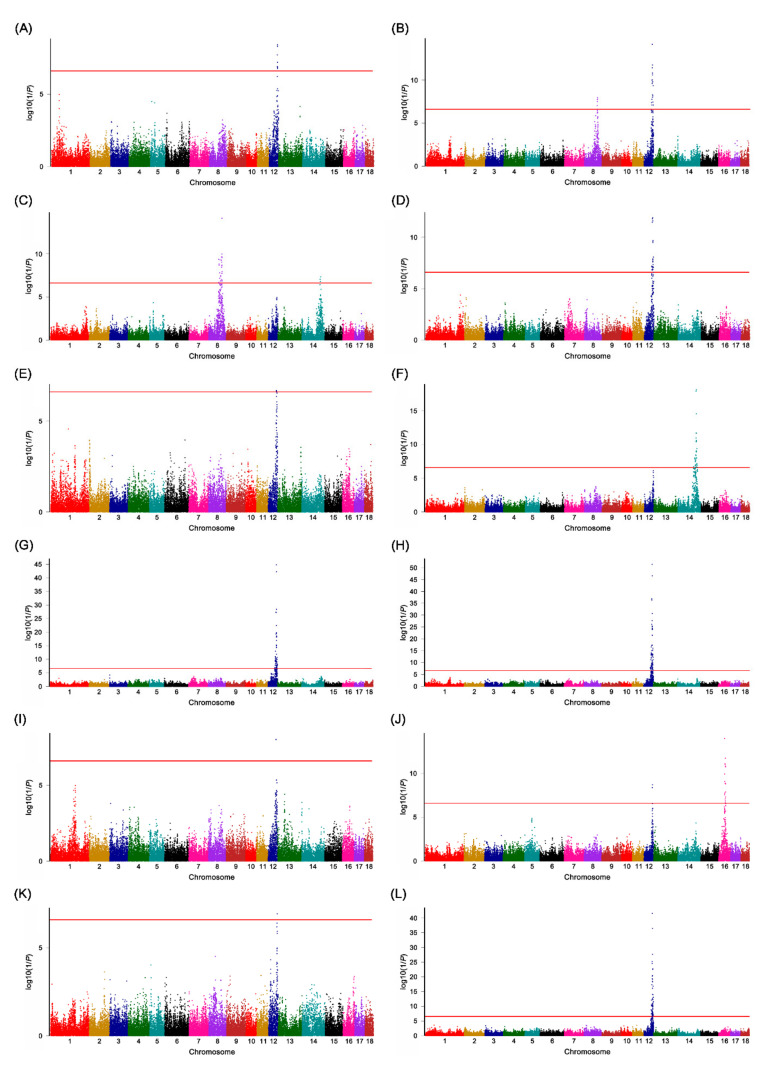
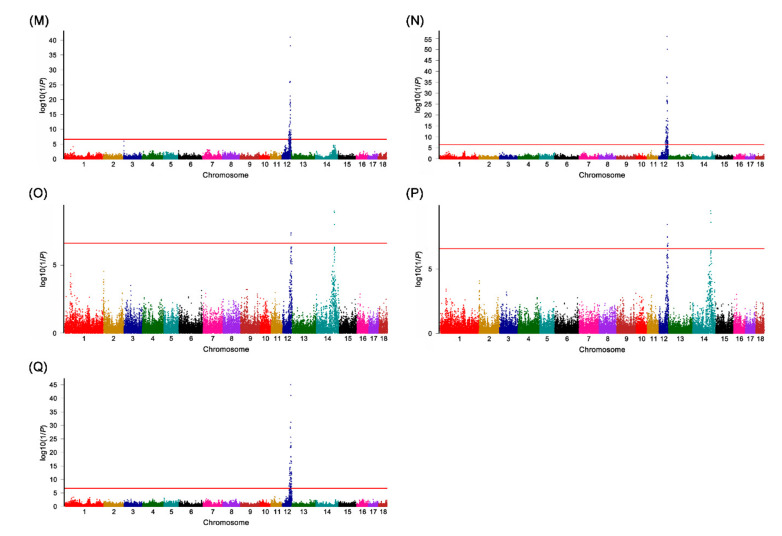
Figure 1.
Manhattan plots of the GWAS for the fatty acid composition traits in the LK cross. The y-axis shows the log10(1/p-value), and the x-axis shows the genomic map positions of the SNP markers on the pig autosomes. The genome-wide significance threshold value is 6.60, which equals a Bonferroni correction of 1% (represented by the red horizontal lines). (A) Manhattan plot for C12:0; (B) Manhattan plot for C16:0; (C) Manhattan plot for C16:1; (D) Manhattan plot for C17:0; (E) Manhattan plot for C17:1; (F) Manhattan plot for C18:0; (G) Manhattan plot for C18:1; (H) Manhattan plot for C18:2; (I) Manhattan plot for C18:3; (J) Manhattan plot for C20:0; (K) Manhattan plot for C20:1; (L) Manhattan plot for C20:4; (M) Manhattan plot for MUFAs; (N) Manhattan plot for PUFA; (O) Manhattan plot for SFA; (P) Manhattan plot for UFA; (Q) Manhattan plot for P/S ratio. The Manhattan plots show the identification of the major QTL for FA profile traits in SSC12.


