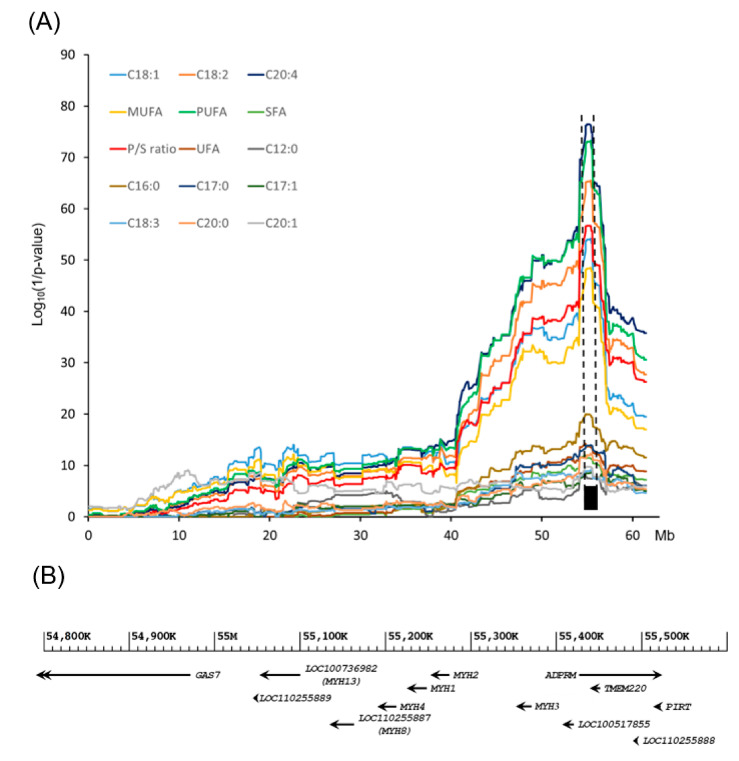
Figure 2.
Post-GWAS high-resolution mapping of a QTL that influences FA composition traits of the longissimus dorsi muscle of the LK cross. (A) LALD mapping results in SSC12 for FA traits. The y-axis shows the log10(1/p-value), and the x-axis shows the genomic map positions of the SNP markers in SSC12. The width of the black rectangle represents 1-LOD drop confidence interval corresponding to the 749.1 kb region in SSC12 (12: 12:54,812,172-55,561,243). (B) Ten NCBI protein-coding genes are located within the 749.1 kb region associated with the FA composition traits. Gene names in parentheses were annotated by our previous study [12].

