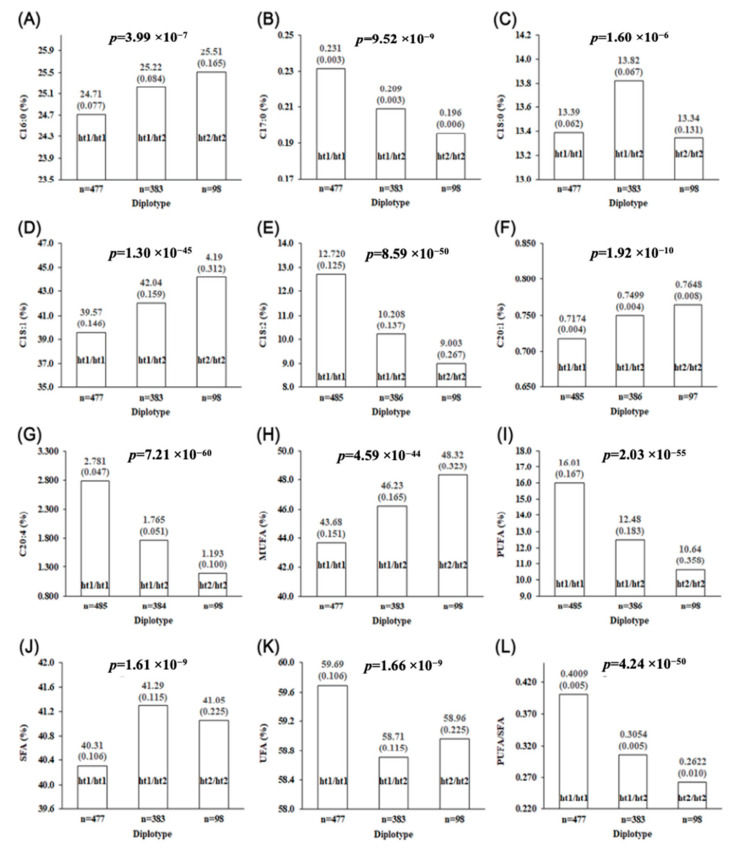
Figure 3.
Haplotypic effect of the variants in GAS7, MYH2, and MYH3 genes on FA profile traits of the longissimus dorsi muscle in the LK cross (p < 0.01). Each bar represents the least square mean of each diplotype of the FA profile traits. The number in parentheses above each bar represents the standard error. (A) Bar graph for C16:0; (B) bar graph for C17:0; (C) bar graph for C18:0; (D) bar graph for C18:1; (E) bar graph for C18:2; (F) bar graph for C20:1; (G) bar graph for C20:4; (H) bar graph for MUFAs; (I) bar graph for PUFAs; (J) bar graph for SFA; (K) bar graph for UFA; (L) bar graph for P/S ratio.

