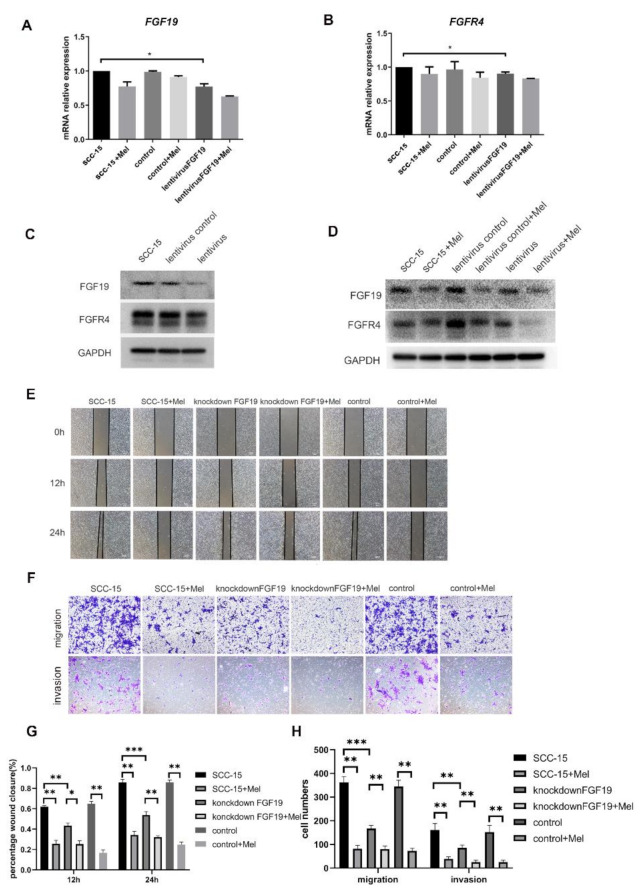
Figure 4.
The mRNA and protein expression levels of FGF19/FGFR4 after FGF19 knocking down. The mRNA (A,B) and protein expression levels of FGF19/FGFR4 (C,D) after hFGF19 knocking down. The invasion and migration ability of cell was determined by trasnwell migration assays at 24 h (F), transwell invasion assays at 36 h (F) and wound healing at 12 h, 24 h, 36 h (E) (Scale bars: (E,G), 100 nm). Quantitative data from three independent experiments are shown in the bottom, respectively (G,H). * p < 0.05; ** p < 0.01, *** p < 0.001.

