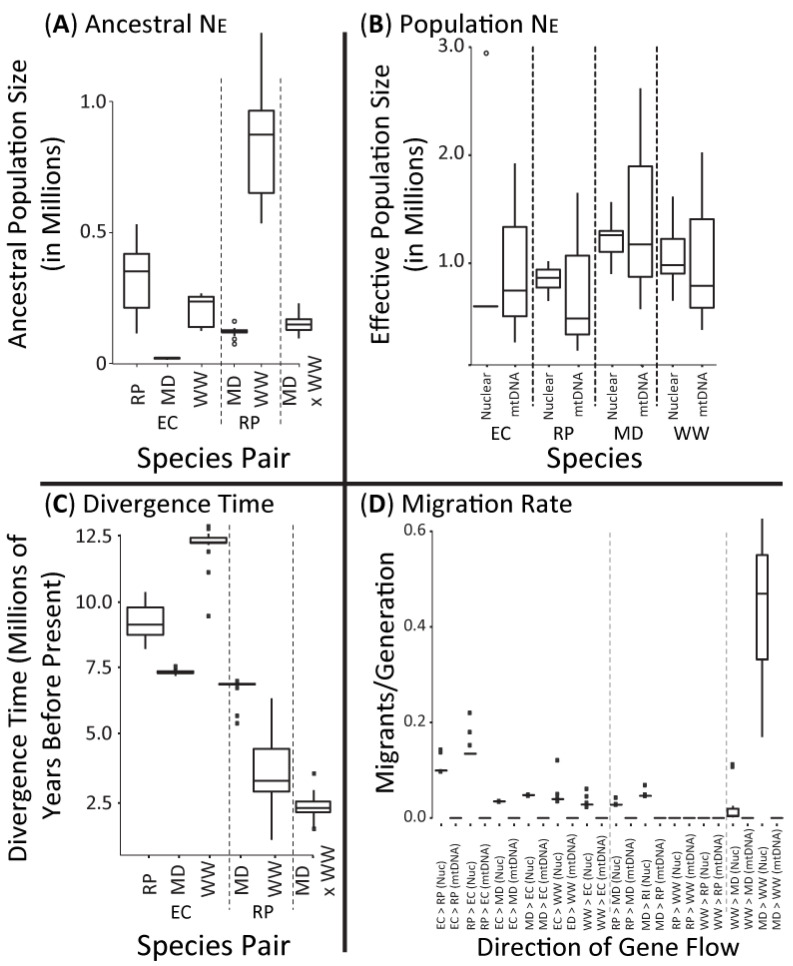
Figure 5.
Box plots are of values across pair-wise species IM and/or ∂a∂i analyses of the mitochondrial (mtDNA) cytochrome oxidase subunit 1 gene or ddRAD-seq autosomal loci, respectively, and estimates of (A) ancestral effective population size, (B) effective population sizes of contemporary Eurasian Collared-Dove (EC), Rock Pigeon (RP), Mourning Dove (MD), and White-winged Dove (WW), (C) divergence time, and (D) migration rates (directionality is denoted as “from > to”). Note that IM analyses of mtDNA did not converge for ancestral effective population size and divergence times (Supporting Information Figures S3–S6); and thus, marker comparisons were only achieved for per-species effective population size and migration rates. For comparison, diamonds within contemporary size estimates (top right) denote the most recent effective population size as obtained from the per species time-series demographic analyses (i.e., Figure 6).

