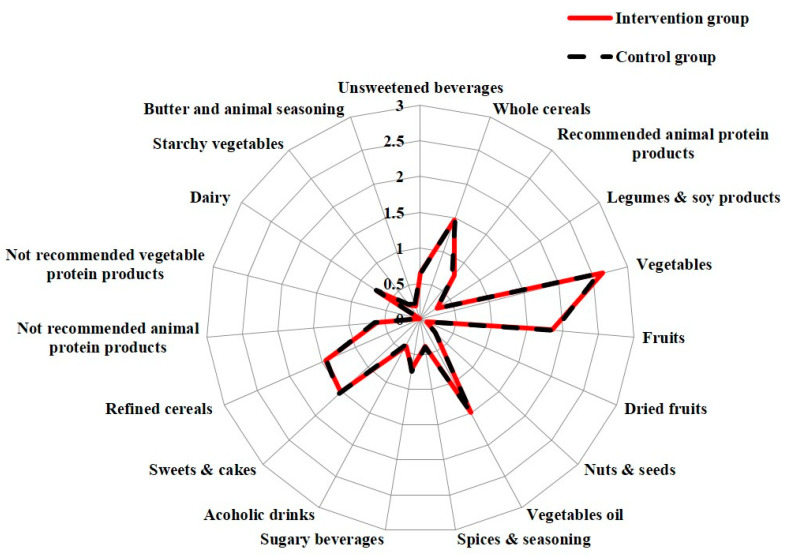
Figure 1.
Baseline daily frequency of consumption of recommended and discouraged food by randomization group. The baseline distribution of frequencies of food consumption in the intervention group and in the control group is represented by a Kiviat diagram. This graphic representation consists of a sequence of rays that originate from a center and forms equal angles to each other; each ray represents one of the food/food group variables. The distance from the central point marked on the radius is the maximum achieved frequency of consumption (time/day). The points on the rays are joined with two segments which are red and continuous for the intervention group and dashed for the control group.

