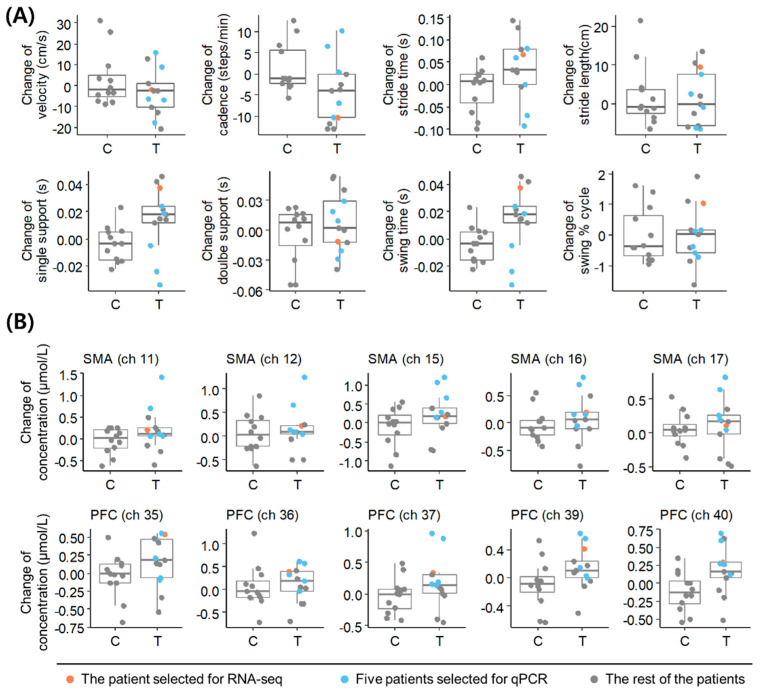
Figure 1.
Clinical information for patients with PD. (A) Changes in gait parameters in the acupuncture treatment group (T) and control group (C) at V8 compared to V1. (B) Changes in oxyhemoglobin level in fNIRS channels in T and C at V8 compared to V1. Data of the representative patient selected for RNA−seq analysis and the other five patients selected for qPCR validation are highlighted with the indicated colors. SMA, supplementary motor cortex; PFC, dorsolateral prefrontal cortex; qPCR, quantitative real-time polymerase chain reaction; PD, Parkinson’s disease.

