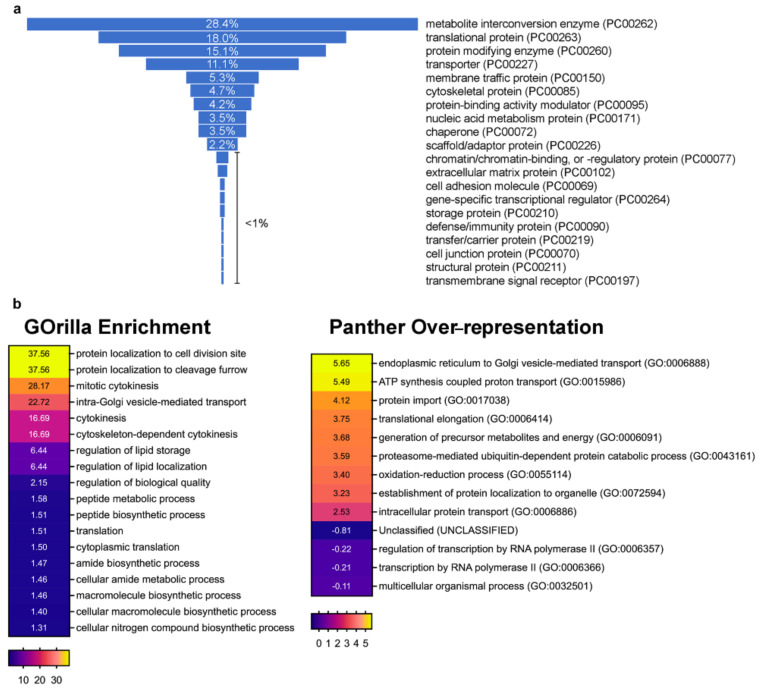
Figure 2.
Protein Classes and GO analyses. (a) Funnel graph showing the classes of proteins identified in our AP-MS experiments and classified according to PANTHER database [41]. The percentage for each class is indicated. See also Supplementary Table S2 for details. (b) Heat maps showing the GO annotation enrichment profiles of the dGOLPH3 interactome. GO enrichment profiles were analyzed using GOrilla tool [42] under the category “process” and PANTHER database [41] under the category “GO-slim biological process”. Over-represented/enriched GO terms are shown in different color shades according to their fold enrichment as indicated in the color scale bar at the bottom; actual fold enrichment values are shown within the heat map (see Supplementary Tables S3 and S4 for p-values). For simplicity and to improve visual representation, for the PANTHER over-representation analysis only the headings for each GO-slim biological process are shown in the graph, while the full results are reported in the Supplementary Table S4. Only results for Bonferroni-corrected analysis (p < 0.05) were considered.

