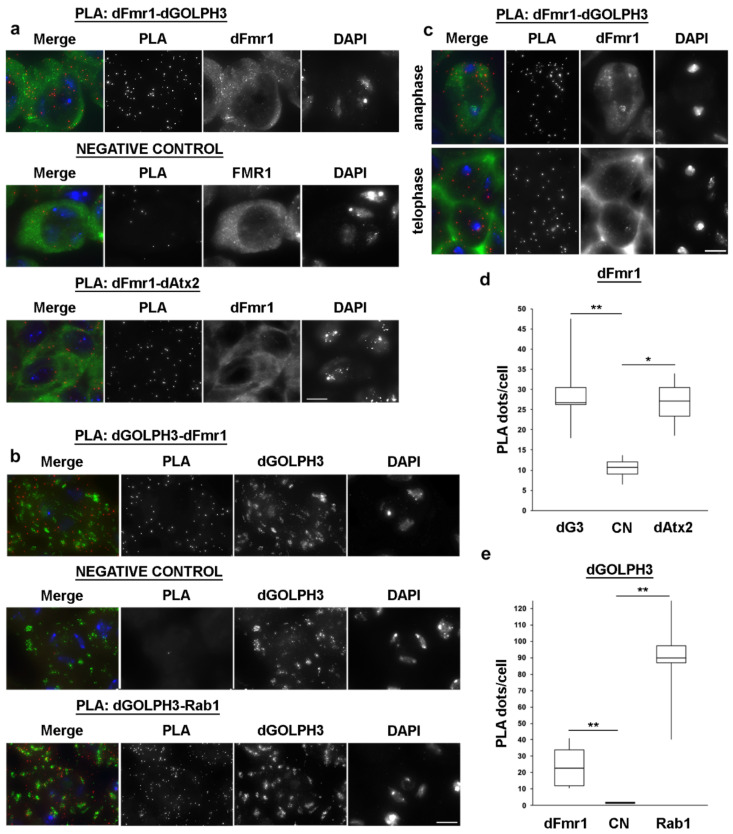
Figure 8.
dFmr1 interacts with dAtx2 and dGOLPH3 in primary spermatocytes. (a,b) Proximity ligation assay (PLA) to visualize dFmr1-dGOLPH3 and dFmr1-dAtx2 interactions in premeiotic spermatocytes. In negative control primary anti-GOLPH3 (a) or anti-dFmr1 (b) antibodies were omitted. dGOLPH3-Rab1 interaction was used in positive control experiments. (c) PLA to visualize dFmr1-dGOLPH3 interaction in dividing spermatocytes. (d,e) Quantification of the PLA signals per cell was obtained as described in Materials and Methods. The box plots show the number of PLA dots per cell in dFmr1-dGOLPH3, dFmr1-dAtx2 and dGOLPH3-Rab1compared to negative controls (CN). dG3, dGOLPH3. A total of 50 cells were randomly selected from images taken in 5 independent experiments. Statistic significant differences are * p < 0.05; ** p < 0.01 (Mann-Whitney test). Bars, 10 μm.

