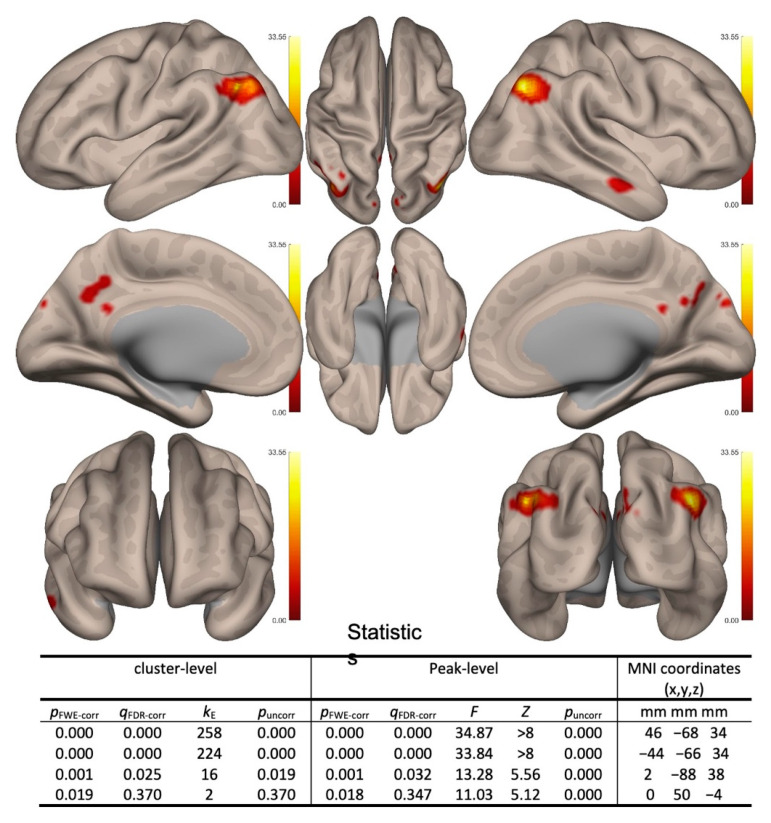
Figure 1.
Between conditions (follow-up vs. baseline) and between subjects (cognitive stimulation therapy (CST) vs. treatment as usual (TAU)) second-level contrast maps with significant results. Positive contrasts (follow-up > baseline and CST > TAU) are shown in red colors. (Note: only default mode network (DMN) showed significant positive contrasts).

