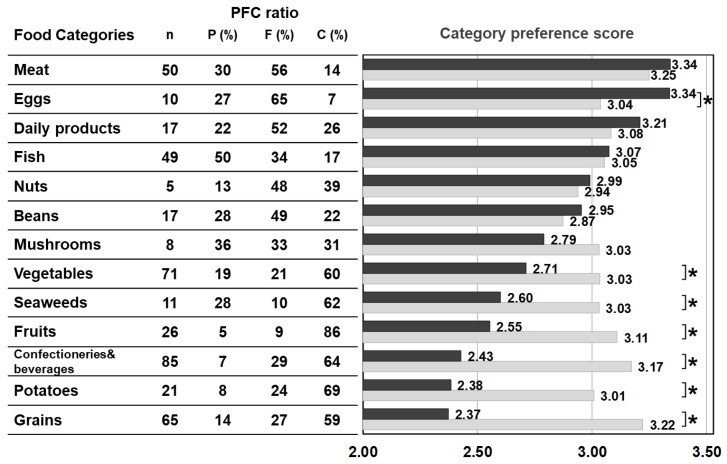
Figure 2.
PFC ratio of the 13 food categories and the category preference score marked by patients with citrin deficiency and control subjects. Black bars: patients, grey bars: control subjects. * p < 0.05. The category preference score is the averaged preference score of foods within the same category, marked by patients and controls.

