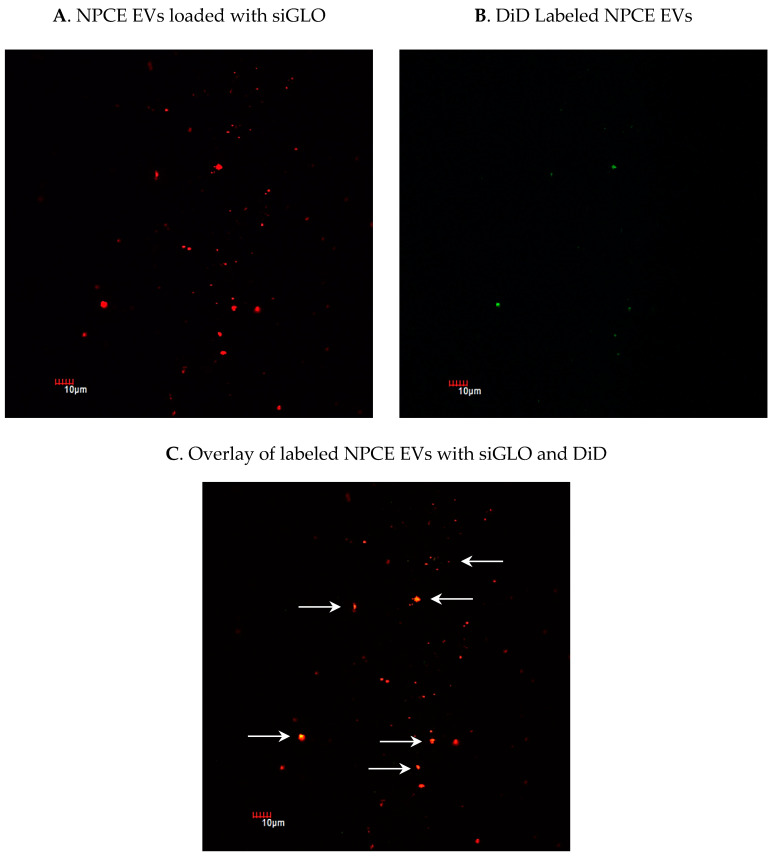
Figure 3.
Using confocal microscopy to detect fluorescent siRNA in labeled NPCE-derived EVs and to track the loading efficiency of siGLO to NPCE EVs following electroporation. Purified NPCE EVs were labeled with fluorescent non-coding siRNA, siGLO (green) and with the membrane dye DiD (red). Pictures of NPCE EV’s membrane labeled with DiD (A) and NPCE EVs loaded with siGLO (B) were integrated (C) to determine the percentage of NPCE EVs positive for both DiD and siGLO markers. A total of 10 pictures from 3 different slides were analyzed for each treatment conducted in three independent experiments.

