Figure 6.
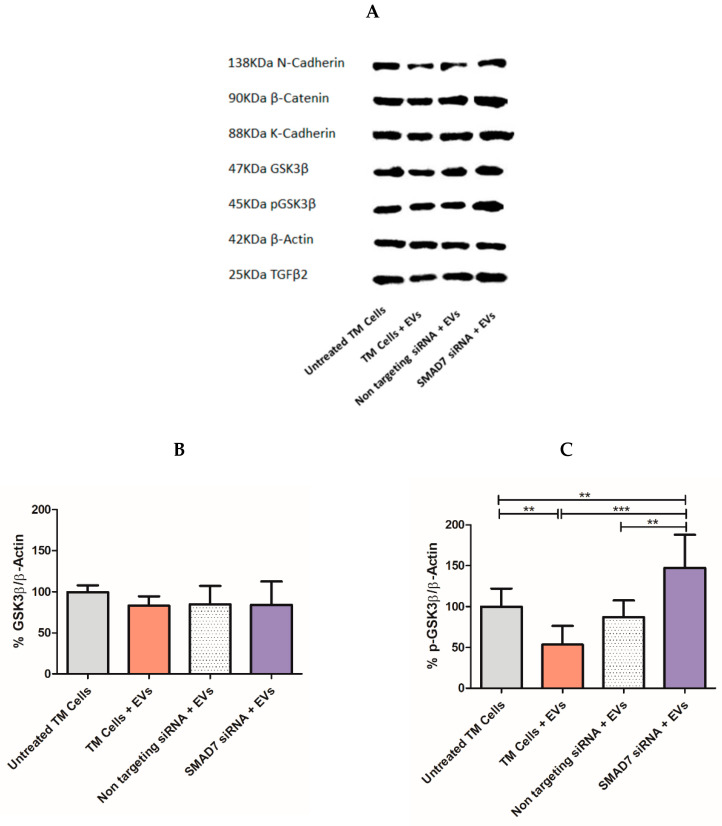
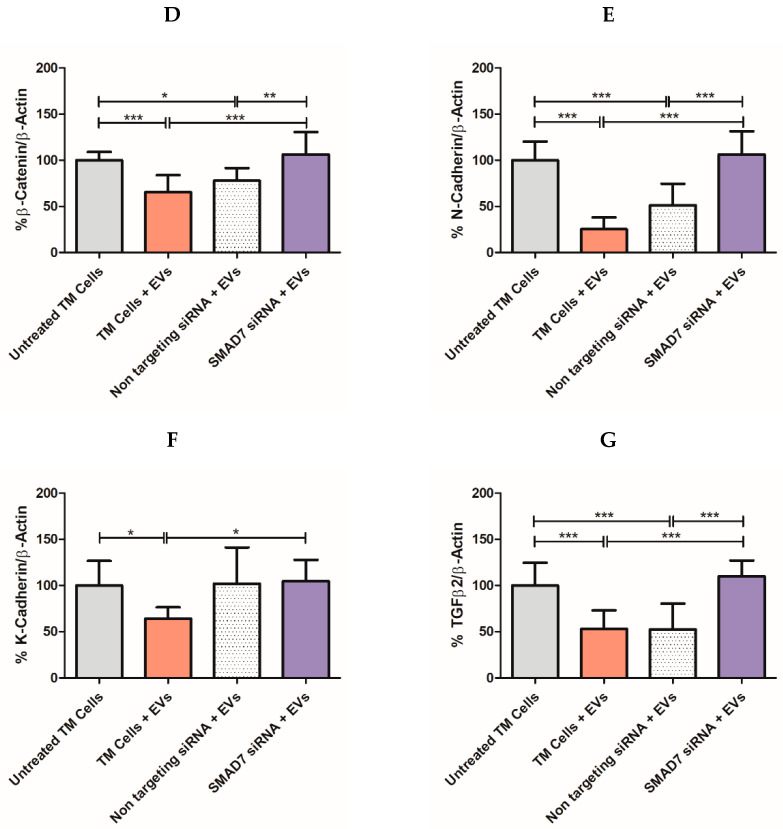
Expression of Wnt-TGFβ2 signaling proteins in TM cells following treatment with NPCE EVs loaded with siRNA. Expression of Wnt-TGFβ2 signaling proteins in TM cells following treatment with NPCE EVs loaded with siRNA. Representative Immunoblots of (A) N-Cadherin (138KDa), β-Catenin (90 KDa), K-Cadherin (88KDa), GSK3β (47KDa), p-GSK3β (45 KDa), and TGFβ2 (25KDa) proteins levels normalized to β-Actin (42 KDa) after 24 h incubation of electroporated NPCE EVs with TM cells. The bar graphs of N-Cadherin (E), β-Catenin (B), K-Cadherin (F), GSK3β (D), p-GSK3β (C), and TGFβ2 (G) represent the means ± SD from three independent experiments performed in triplicates. One-way ANOVA was used to determine statistical difference, as indicated by asterisks (* p < 0.05, ** p < 0.01, *** p < 0.001).


