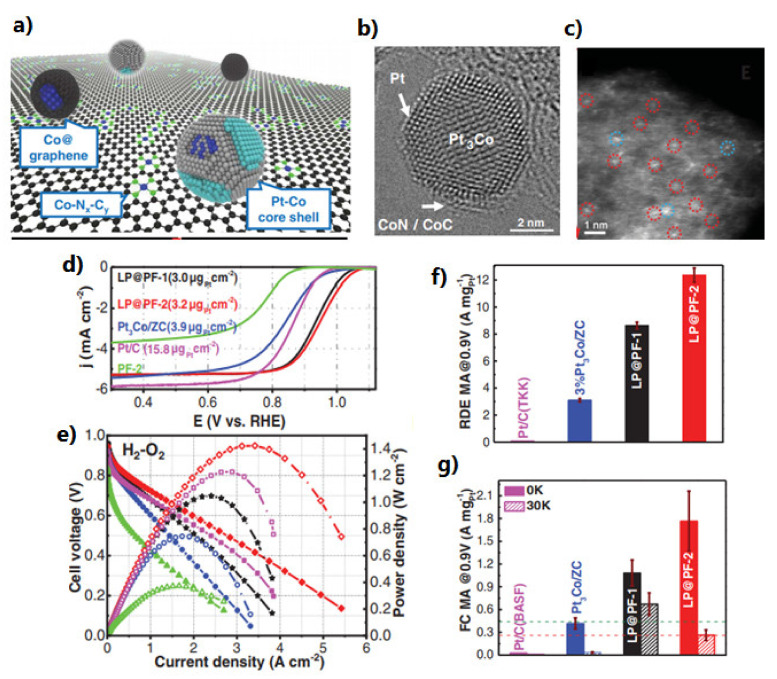
Figure 17.
(a) Schematics of LP@PF catalysts, showing coexistence of Pt-Co NPs, Co@graphene, and Co-Nx-Cy PGM-free active sites. (b) HAADF-STEM image of Pt-Co NPs in LP@PF-1. (c) PGM-free support containing atomically dispersed Co (circled in red) and trace Pt (circled in blue). (d) LSVs of different catalysts recorded at a rate of 10 mV s−1 and 1600 rotations per minute in O2-saturated 0.1 M HClO4; j, current density. (e) H2-O2 fuel cell i-V polarization (solid symbols and lines) and power density (hollow symbols and dashed lines) plots recorded under 1 bar of O2 pressure with cathode Pt loading of 0.033 mgPt cm−2 for LP@PF-1 (black stars), 0.035 mg Pt cm−2 for LP@PF-2 (red diamonds), 0.043 mgPt cm−2 for Pt3Co/ZC (blue spheres), and 0.35 mgPt cm−2 for commercial MEA (magenta squares); PF-2, green triangles. (f) Comparison of MAs at 0.9 V versus RHE. (g) Fuel cell (FC) MAs at 0.9 V iR-free before (solid) and after (hatched) 30,000 voltage cycles, showing that LP@PF catalysts meet or exceed DOE’s 2025 MA targets for before (green dashed line, 0.44 A mgPt−1) and after (red dashed line, 0.264 A mgPt−1 or 40% of the initial value) AST. [255]. Reprinted with permission from AAAS.

