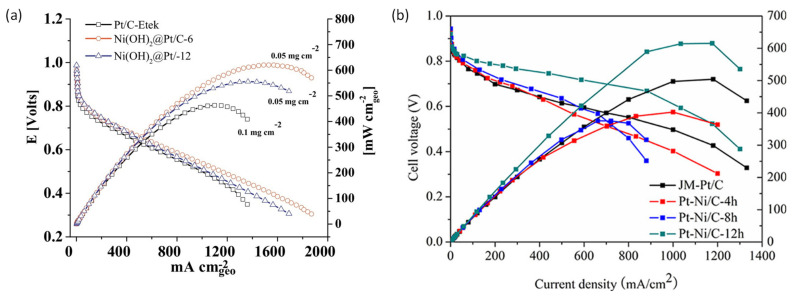
Figure 25.
(a) Performance curves from single-cell configurations for Pt/C and Ni(OH)2@Pt/C with different catalyst loading. Reproduced with permission from Elsevier (reference [321]) and (b) Single-cell performance curves of different Pt-Ni cathode catalysts prepared at 200 °C for different times. Reprinted with permission from reference [296]. Copyright 2016 American Chemical Society.

