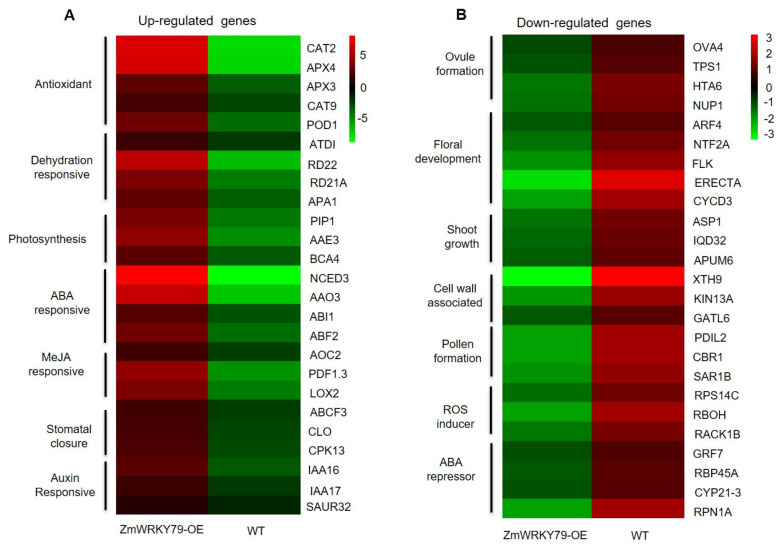
Figure 6.
Key differentially expressed genes (DEGs) in WT and ZmWRKY79-OE plants under drought stress. Up-regulated (A) and down-regulated genes (B) in WT and ZmWRKY79-OE plants under drought stress simulated by 20% PEG6000 treatment for 24 h. The color scale indicates the mean fold-change of three biological replicates.

