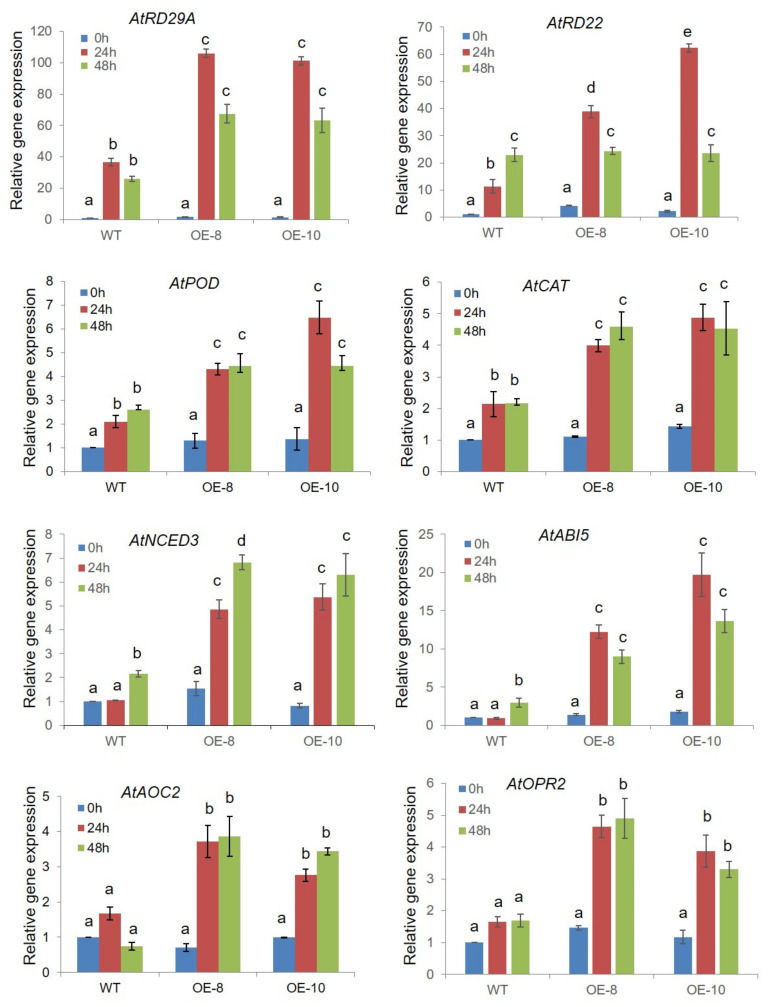
Figure 7.
Gene expression validation of ZmWRKY79 regulated genes. qRT-PCR analysis of ZmWRKY79 regulated genes in OE plants (OE-8 and OE-10) and WT plants with 20% PEG6000 treatment for 0, 24, and 48 h. Atactin was used as the endogenous control gene, and the expression level was normalized to the untreated WT (0 h). Different lowercase letters indicate significant difference (LSD test, p < 0.05). Error bars indicate SD (n = 3).

