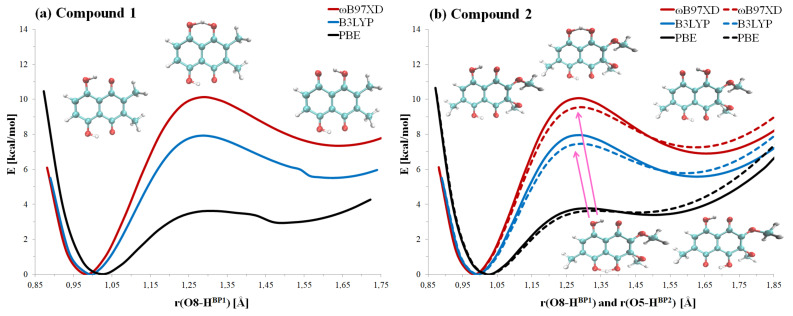
Figure 2.
The potential energy profiles for the proton motion in the hydrogen bridges of compounds 1 (a) and 2 (b), respectively. The hydrogen bridges denoted as O8-H...O1 (Bridge 1) for compound 1 and O8-H...O1 (Bridge 1) and O5-H...O4 (Bridge 2) for compound 2 are presented. In the case of 2, the solid line denotes Bridge 1 while the dotted line denotes Bridge 2.

