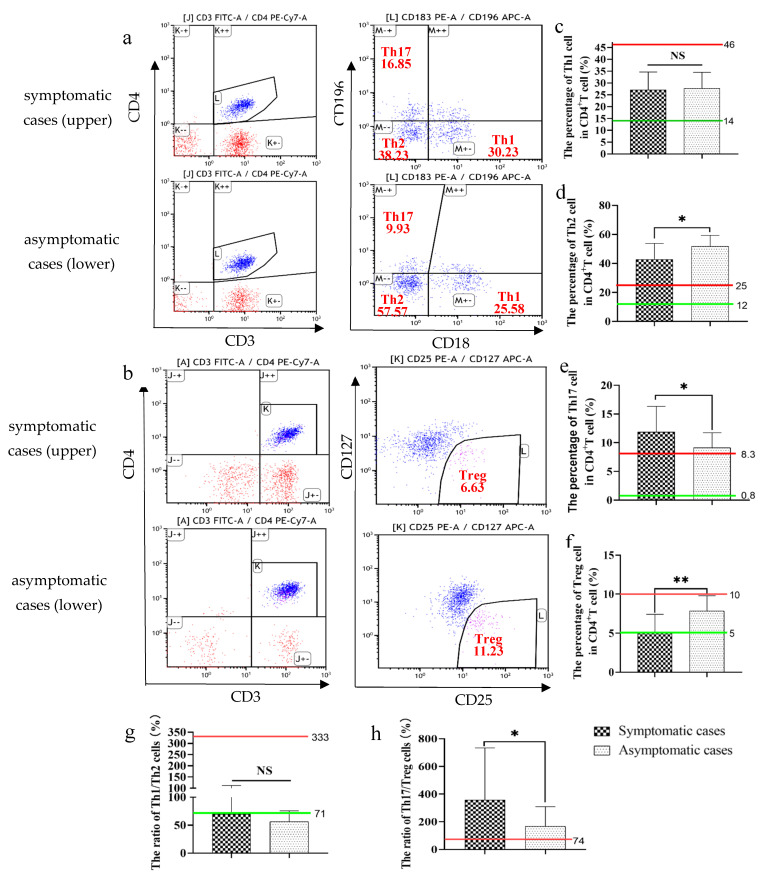
Figure 3.
The percentage of subsets of CD4 T lymphocytes in the asymptomatic and symptomatic cases with COVID-19. A representative flow cytometry figure is shown in (a,b). The following indexes were analyzed, including the percentage of Th1 cells (c), the percentage of Th2 cells (d), the percentage of Th17 cells (e) and the percentage of Treg cells (f), the ratio of Th1 to Th2 (g) and Th17 to Treg (h). Green line: the normal lower limit. Red line: the normal upper limit. Each dot represents single cell. The red numbers in the figure caption represent the percentage of cells in the corresponding quadrants. Bar graphs show the mean ± s.d. * p < 0.05; ** p < 0.01. NS: no statistical significance.

