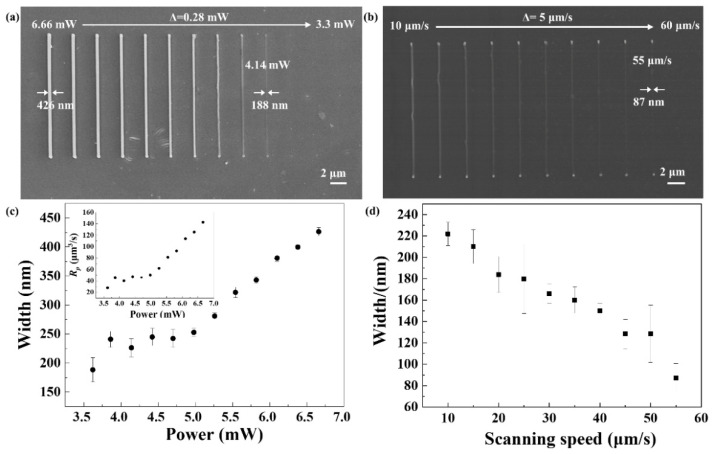
Figure 2.
(a) SEM image of nanolines achieved with laser power ranging from 6.66 to 3.3 mW at 10 μm/s. (b) SEM image of nanolines achieved with scanning speed ranging from 10 to 60 μm/s at 6.40 mW. (c) The dependence of line width and polymerization rate (inset) on laser power, respectively. (d) The dependence of line width on scanning speed.

