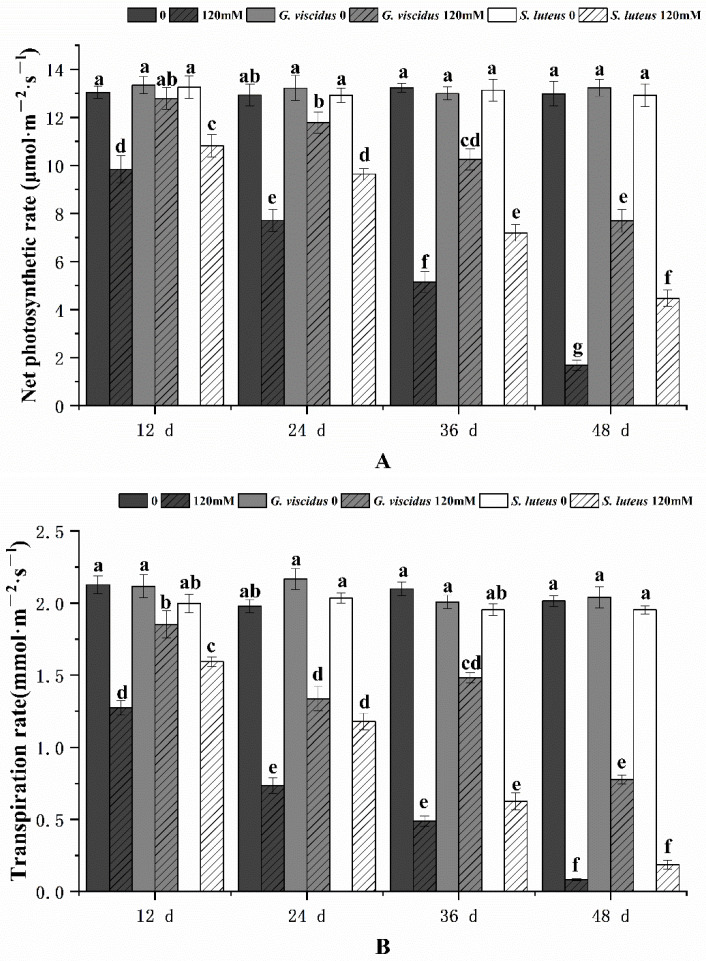
Figure 4.
Changes in the net photosynthetic rate (A) and transpiration rate (B) in ectomycorrhizal seedlings of Q. mongolica under NaCl stress. Bars represent means of five replicates (±SD). For each parameter, bars with different letters indicate significant differences among treatments, p ≤ 0.05, following one-way ANOVA.

