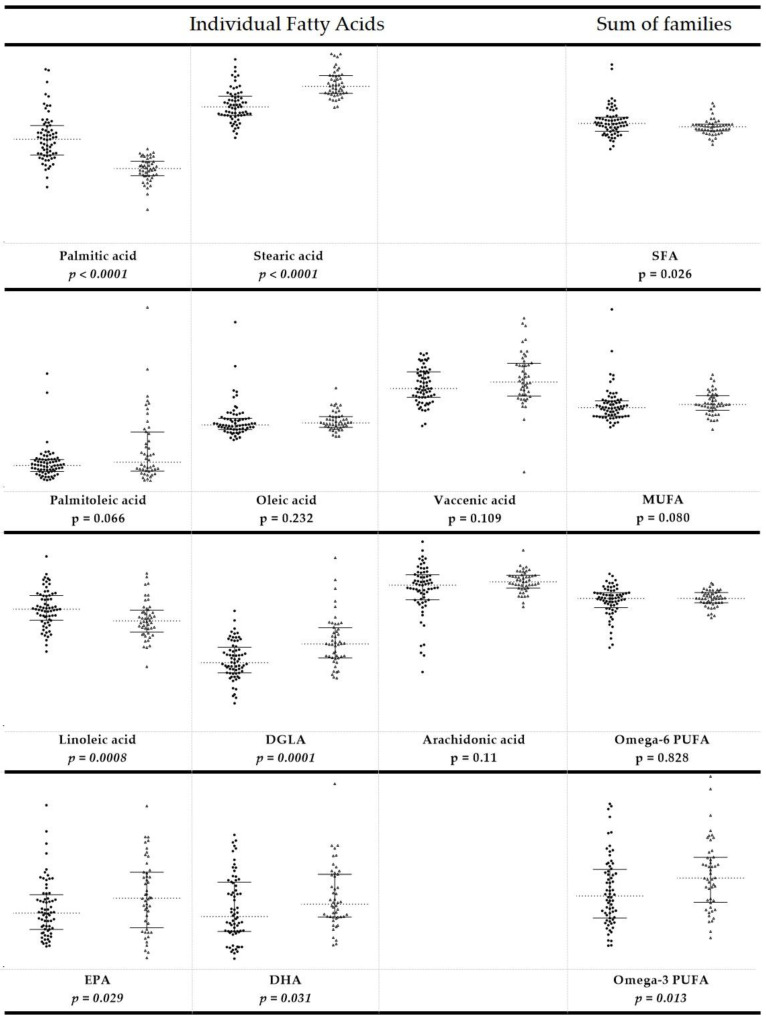
Figure 1.
Scatter dot plot of the individual fatty acids and the corresponding families in the population of dogs affected by chronic enteropathy (n = 48, triangles, right) compared to the values obtained from healthy dogs (n = 68, circles, left). Each member of the fatty acid family is given in a row, the last column being the sum of the corresponding fatty acid family. Horizontal dashed lines represent the median values. The end points of the vertical lines show interquartile range. The p-values are reported, with values significantly different in italic.

