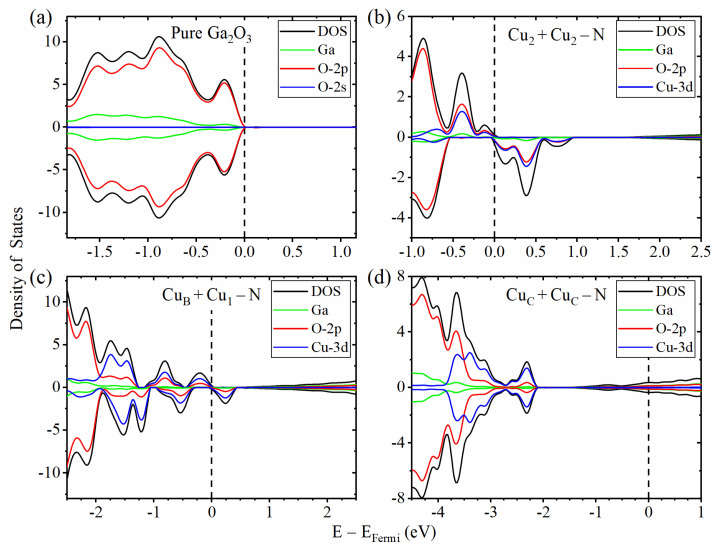
Figure 3.
The PDOS of pure (a) and doped : (b), (c) and (d). The dashed line represents the Fermi level, the black solid line represents the total density of states, the green and red lines represent the projected density of states of Ga and O-2p orbits, respectively. The blue lines represent O-2s orbit in Figure (a) and represent Cu-3d orbits in Figure (b–d). The positive (negative) DOS is the DOS with spin up (down).

