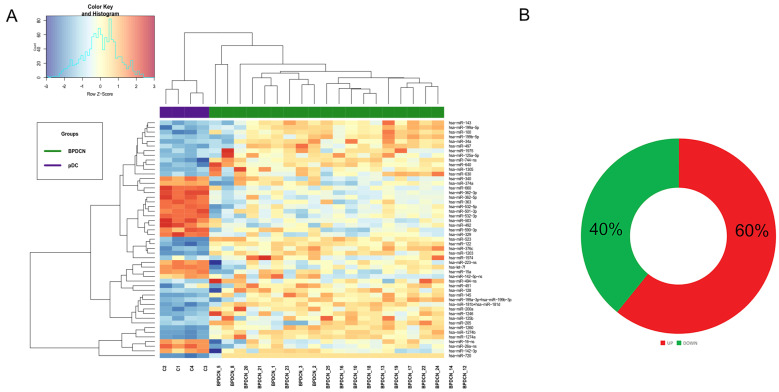
Figure 1.
MicroRNA expression profiling of in blastic plasmacytoid dendritic cell neoplasm (BPDCN). (A) Heat map of genes differentially expressed in BPDCNs vs. plasmacytoid dendritic cells (pDCs), according to differential expression analysis. Tumor BPDCN samples are reported in green and pDC control samples in purple; (B) MiRNAs upregulated and downregulated are graphically represented by a donut chart.

