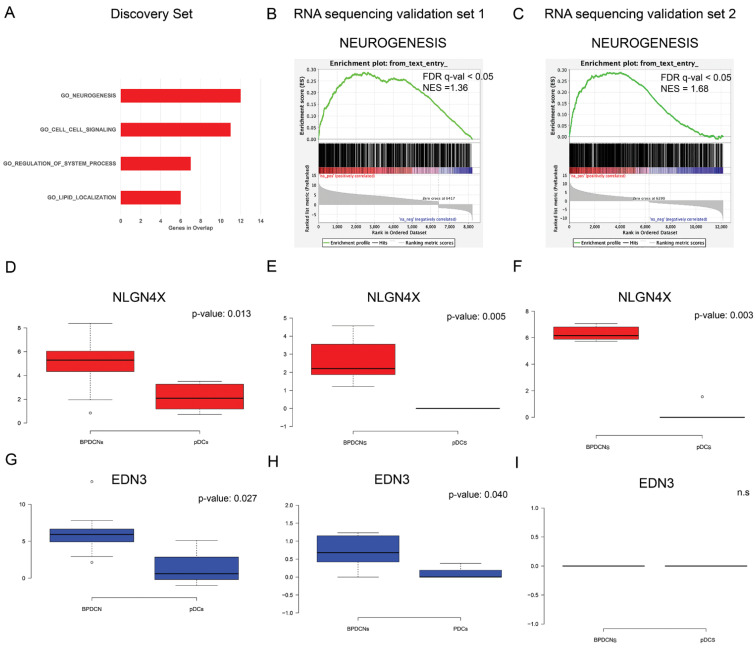
Figure 3.
MiRNA network functional analysis. (A) The top four biological processes emerged, as significantly enriched in 57 network-genes by gene ontology (GO) analysis, are reported from the top to the bottom, from the most enriched to the lowest; (B,C) Pre-ranked Gene set enrichment analysis (GSEA) indicated that GO_neurogenesis gene set was significantly enriched in the RNA sequencing transcriptome of BPDCN compared with pDC samples in RNA sequencing validation set 1 and 2, respectively. Normalized enrichment scores (NES) and false discovery rate (FDR) q-values are given for the gene set. (D–F) Box plots showed in red the relative mRNA expression of NLGN4X in discovery set in RNA sequencing validation set 1 and 2, respectively. NLGN4X was significantly overexpressed in BPDCNs vs. pDCs in all the analyzed sets. (G–I) Box plots showed in blue the relative mRNA expression of EDN3 in discovery set and in RNA sequencing validation set 1 and 2, respectively. EDN3 was significantly overexpressed in the discovery set and RNA sequencing validation set. Box plots were created by webtool BoxPlotR. Center lines show the medians; box limits indicate the 25th and 75th percentiles as determined by R software; whiskers extend 1.5 times the interquartile range from the 25th and 75th percentiles, outliers are represented by dots. Statistical analysis was performed using Kruskal–Wallis rank sum test for multiple independent samples.

