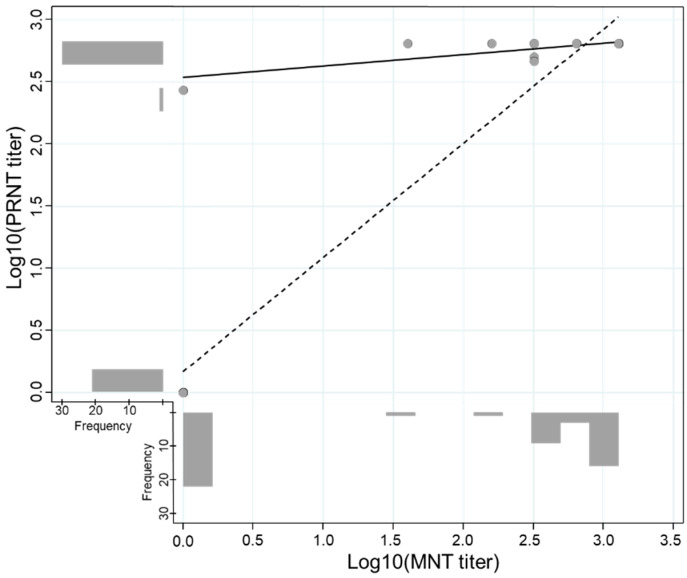
Figure 3.
Correlation of log-transformed titers of the Plaque Reduction Neutralization (PRNT) and Microneutralization (MNT) Tests. The scatter plot illustrates the correlation between the log-transformed PRNT and MNT titers. The correlation including and excluding negative results is represented by the dashed line (n = 31, Spearman’s Rho = 0.419, p-value = 0.019) and solid line (n = 51, Spearman’s Rho = 0.901, p-value < 0.001), respectively.

