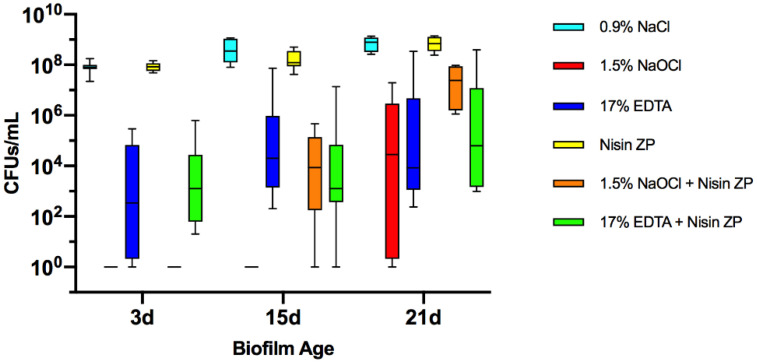
Figure 1.
Boxplots demonstrating cell counts after 5 min treatments with 1.5% sodium hypochlorite (NaOCl); 17% EDTA; high-purity nisin (nisin ZP) and their associations on multispecies biofilms grown on hydroxyapatite disks for 3, 15 and 21 days. The internal line represents the median; the whiskers indicate minimum and maximum. Data derived from three independent experiments, each represented in triplicate biofilm cultures (n = 9).

