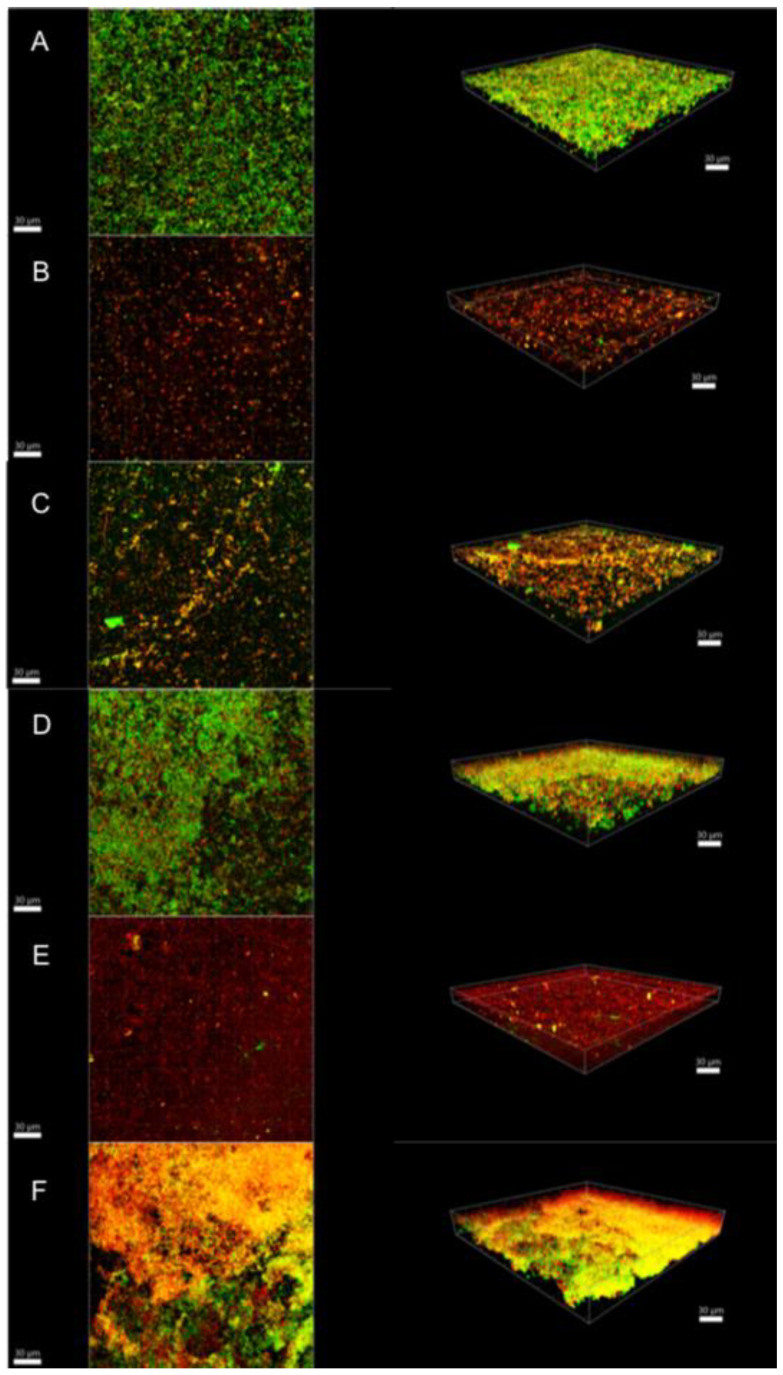
Figure 2.
Confocal laser scanning microscopy images of 3-day biofilms. (A) Saline; (B) 1.5% NaOCl; (C) 17% EDTA; (D) high-purity nisin; (E) 1.5% NaOCl + high-purity nisin and (F) 17% EDTA + high-purity nisin. The biofilms were stained using the LIVE/DEAD Viability Kit; live cells appear green and dead cells red. Images represent the 3D reconstructions of the biofilms using IMARIS 7.6.5 software (orthogonal and perspective views from left to right). Scale bar 30 μm.

