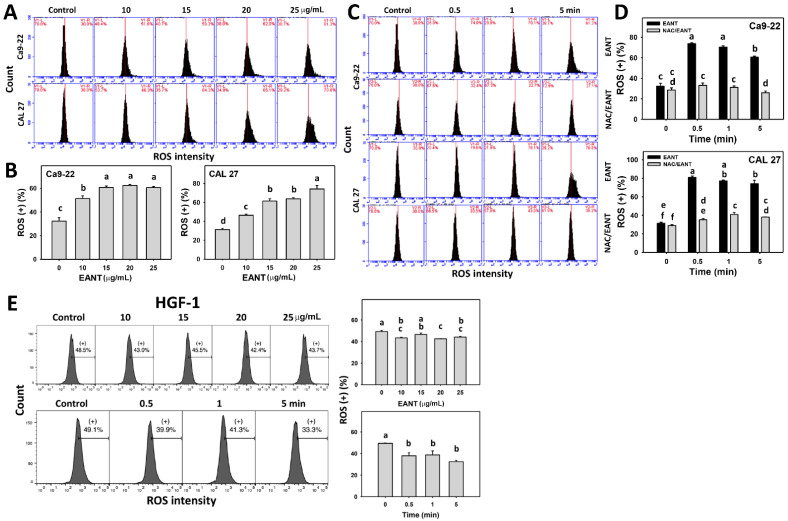
Figure 5.
ROS analysis. (A,B) ROS pattern and statistical analysis for EANT treated oral cancer cells (CAL 27 and Ca9-22) for 5 min. (C,D) NAC (10 mM) pretreatment outcome to ROS patterns and statistical analysis in EANT treatments (0 and 25 μg/mL) for 0, 0.5, 1, and 5 min. (E) ROS pattern and statistical analysis for EANT treated normal oral (HGF-1) cells for different concentrations (0, 10, 15, 20, and 25 μg/mL for 5 min) and treatment times (25 μg/mL for 0, 0.5, 1, and 5 min) of EANT. Data (means ± SD, n = 3) showing different letters on-top differ significantly for multiple comparisons (p < 0.05).

