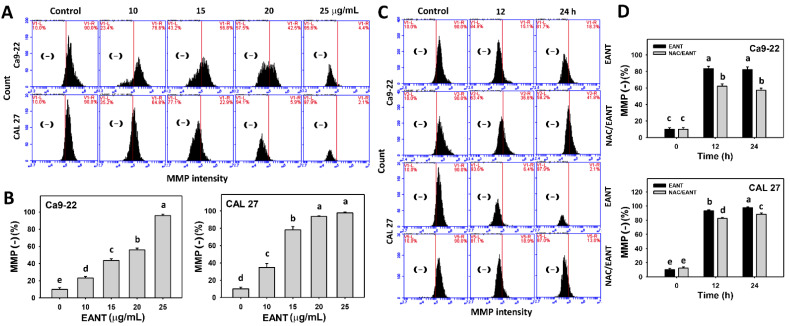
Figure 7.
MMP analyses. (A,B) MMP patterns and statistical analysis for EANT treated oral cancer cells (CAL 27 and Ca9-22) for 24 h. (C,D) NAC (10 mM) pretreatment outcome on MMP patterns and statistical analysis in EANT treatments (0 and 25 μg/mL) for 0, 12, and 24 h. Data (mean ± SD, n = 3) showing different letters on top differ significantly for multiple comparisons (p < 0.05).

