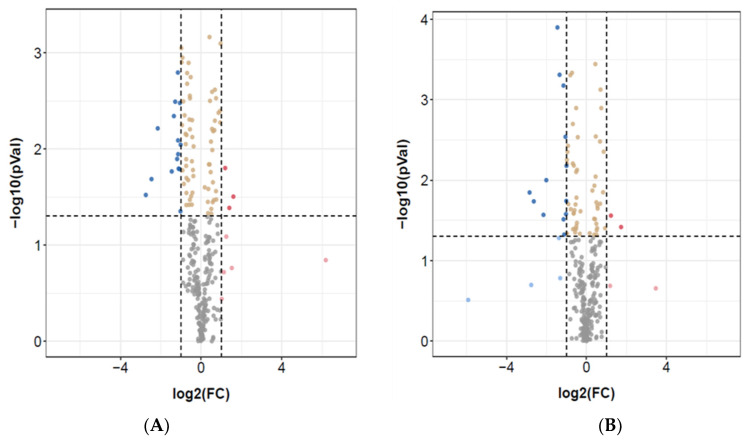
Figure 1.
Differential expression of miRNAs in LCL groups. (A) Volcano plot of differentially expressed miRNAs in ASD and control LCLs. (B) Volcano plot of differentially expressed miRNAs in ASD and Siblings LCLs. The red dots are up-regulated, and the blue dots are down-regulated; the gray dots denote no change; the yellow dots are not significant. n = 9–10 in each group. To determine significant genes (red and blue color dots), the p-value cut-off was set to 0.05.

