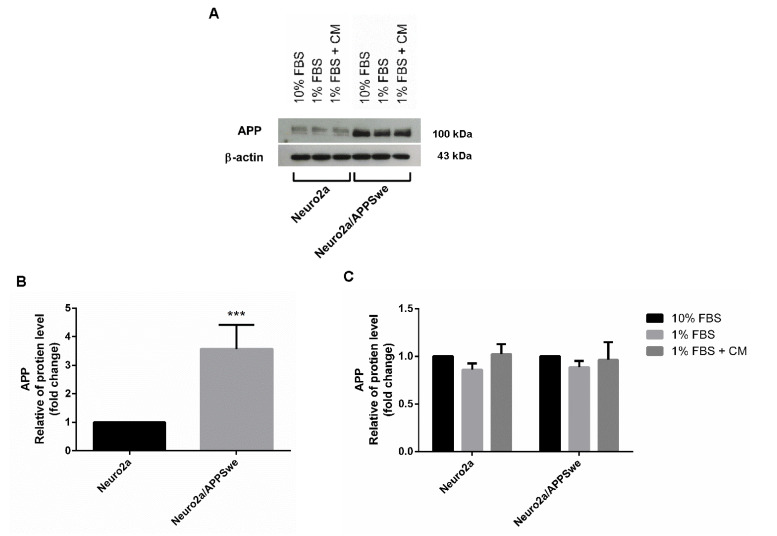
Figure 4.
APP expression level. (A) Western blot analysis revealed that APP expression in Neuro2a/APPSwe cells was higher than that in Neuro2a cells. (B) In 1% FBS medium, APP was significantly different between wild-type cells and APPSwe-overexpressing Neuro2a cells (C) The APP levels between treatment groups of Neuro2a and Neuro2a/APPSwe cells were normalized vs. the 10% FBS group for each cell type. The analysis showed that Neuro2a/APPSwe cells exhibited higher levels of APP than Neuro2a cells. APP level in both cells did not differ in 10% FBS, 1% FBS, and 10 µg/mL CM extract in 1% FBS treatment. Values are mean ± SD of at least three independent experiments. *** p-value < 0.001.

