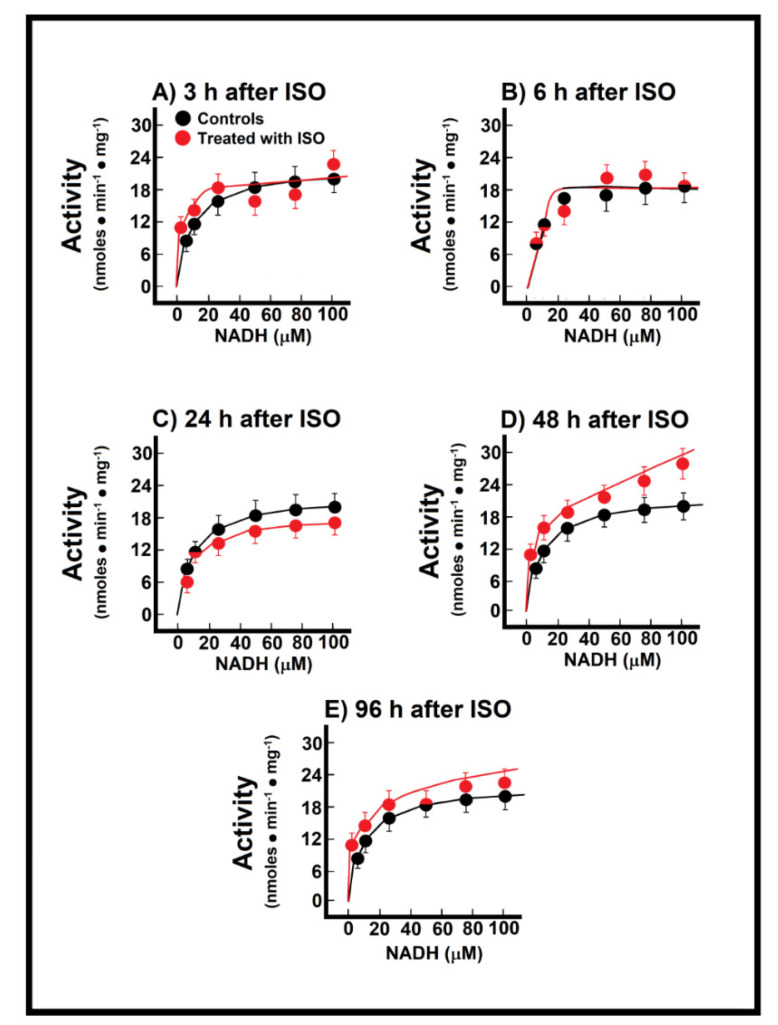
Figure 4.
Temporal course of endogenous NADH oxidation at 3 h (Panel (A)), 12 h (Panel (B)), 24 h (Panel (C)), 48 h (Panel (D)) and 96 h (Panel (E)) after ISO treatment. Changes of endogenous NADH oxidation during induction of myocardial infarction. Results are expressed as mean ± S.E. of three control animals and five rats treated with ISO per experimental point of the kinetics of the reconstituted malate-aspartate shuttle (MAS). Symbols for the experimental groups at the top of panel (A). Temporal course of endogenous NADH oxidation at 3 h (Panel (A)), 12 h (Panel (B)), 24 h (Panel (C)), 48 h (Panel (D)) and 96 h (Panel (E)) after ISO treatment.

