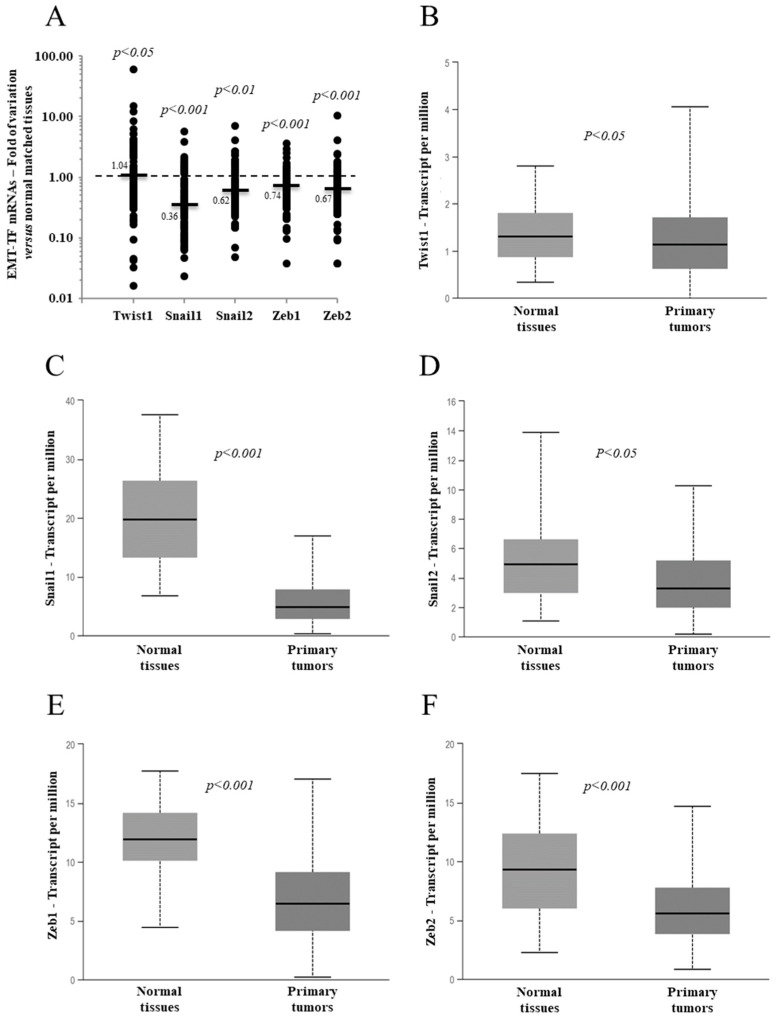
Figure 1.
Expression level of the EMT transcription factors (EMT-TFs) in 95 papillary thyroid cancer (PTC) tissues compared with the normal matched tissues from our case study (A) or from The Cancer Genome Atlas network (B–F) case study consisting of 59 normal tissues and 505 PTC tissues. (A) The small bars represent the median with the values indicated. The dotted line represents the expression level for the normal matched tissues. (B–F) The data are presented as a box plot reporting the median value (small bar) and the first (lower box limit) and third (upper box limit) quartiles and range of the values observed for each gene.

