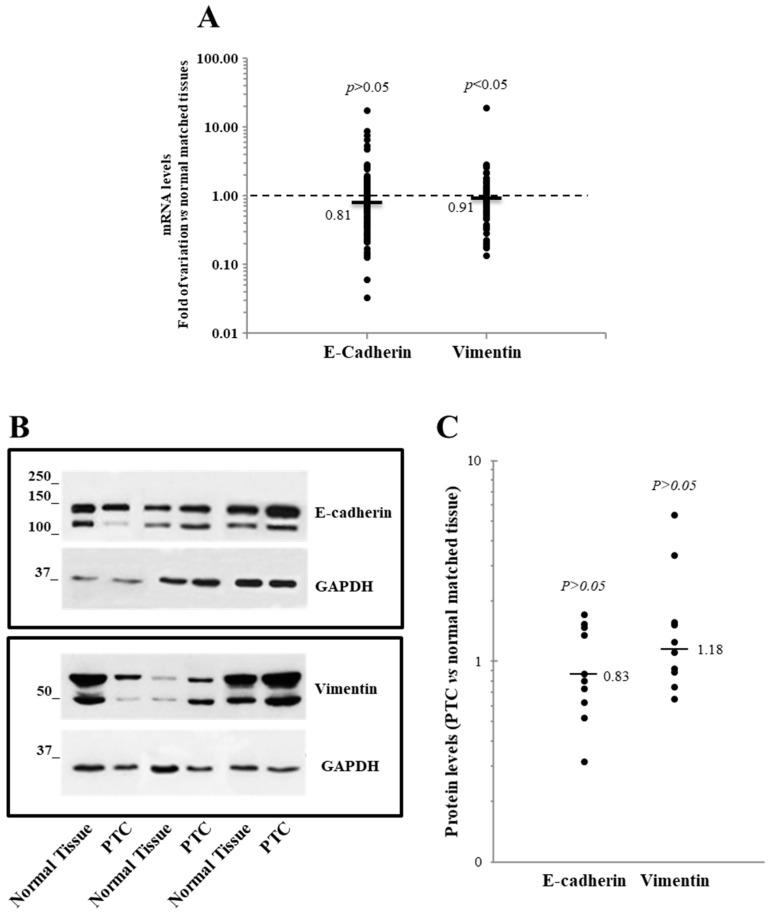
Figure 2.
Expression level of the E-cadherin and vimentin in 95 papillary thyroid cancer (PTC) tissues compared with the normal matched tissues. (A) The E-cadherin and vimentin mRNA levels are reported. The small bars represent the median, with the values indicated. The dotted line represents the expression levels for the normal matched tissues. (B,C) The E-cadherin and vimentin Western blot results obtained on 10 PTC tissues and their normal counterparts. (B) A representative Western blot image shows three PTC, and the normal matched tissue are shown. (C) A densitometric analysis of the 10 PTC tissues analyzed is reported.

