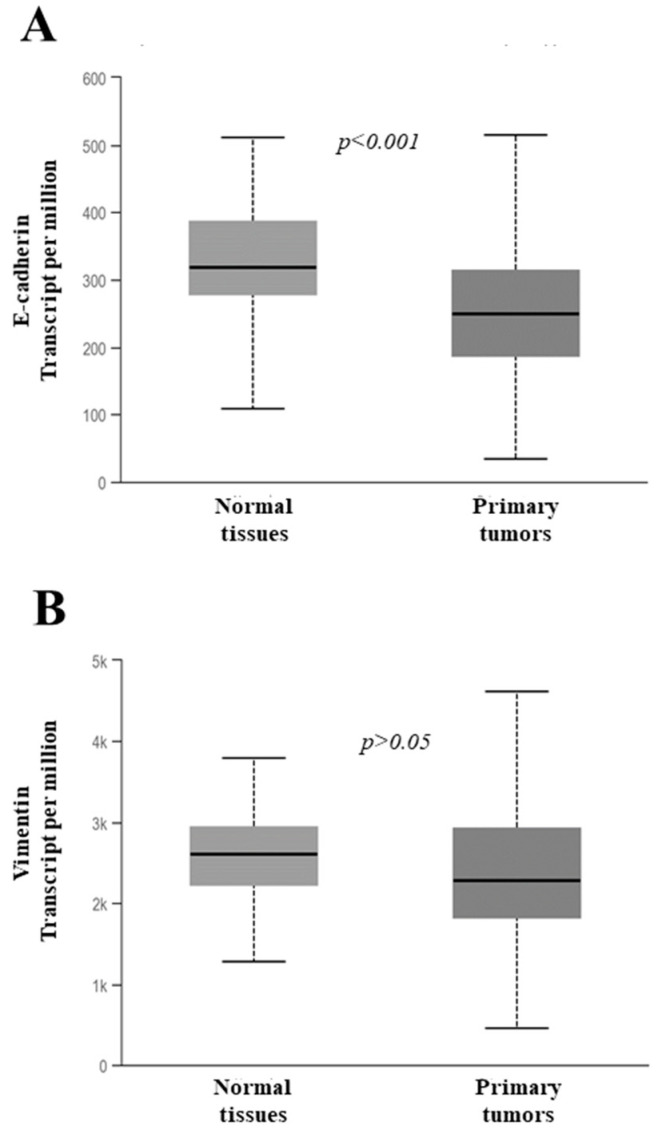
Figure 3.
Expression level of the E-cadherin gene and vimentin from The Cancer Genome Atlas network case study consisting of 59 normal tissues and 505 PTC tissues. (A,B) The data are presented as a box plot reporting the median value (small bar) and the first (lower box limit) and third (upper box limit) quartiles and the range of the values observed for each gene.

