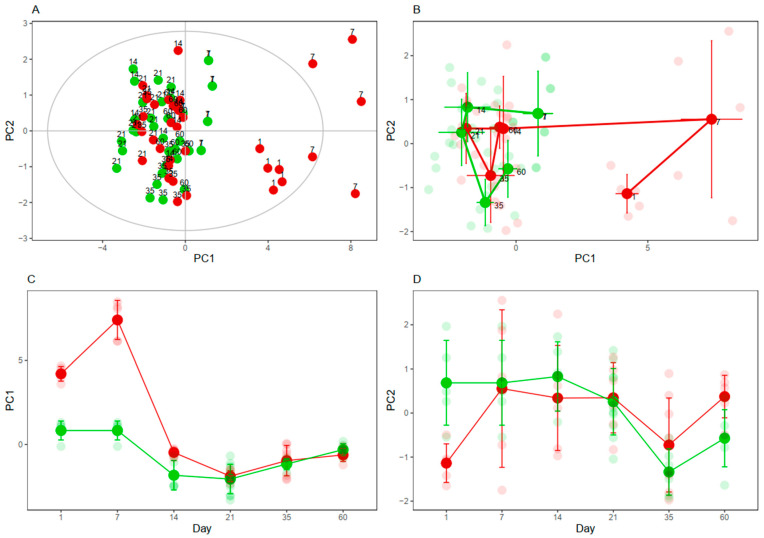
Figure 5.
Impact of CIH on cysteine-related thiols. (A) Principal Component Analysis performed with the 11 thiol fractions and 74 observations; the first and second components explained 63 and 11% of the variance of the data, respectively. (B) Geometric Trajectory Analysis showing PC1 vs. PC2. (C) Geometric Trajectory Analysis showing PC1 vs. time. (D) Geometric Trajectory Analysis showing PC2 vs. time. Rats submitted to Nx are colored in green and rats submitted to CIH are colored in red. Smaller and lighter dots represent individual rats; bigger and more intense dots represent the average values at (B–D). Nx7D was used as control for CIH1D and CIH7D. PC: Principal Component.

